

You might already be using Confluence and Jira, but are you using them together? When combined, these tools help you save time, streamline tedious manual processes, and ensure everyone has all the resources and context they need in one place.
In this Better Together series, we’re highlighting the distinct ways your team can use these two tools in tandem for better results in key areas of your workflows. This blog will cover the benefits of using Confluence and Jira together for progress and performance reporting and the key features you can start using today.
Upgrade your reporting with Confluence + Jira
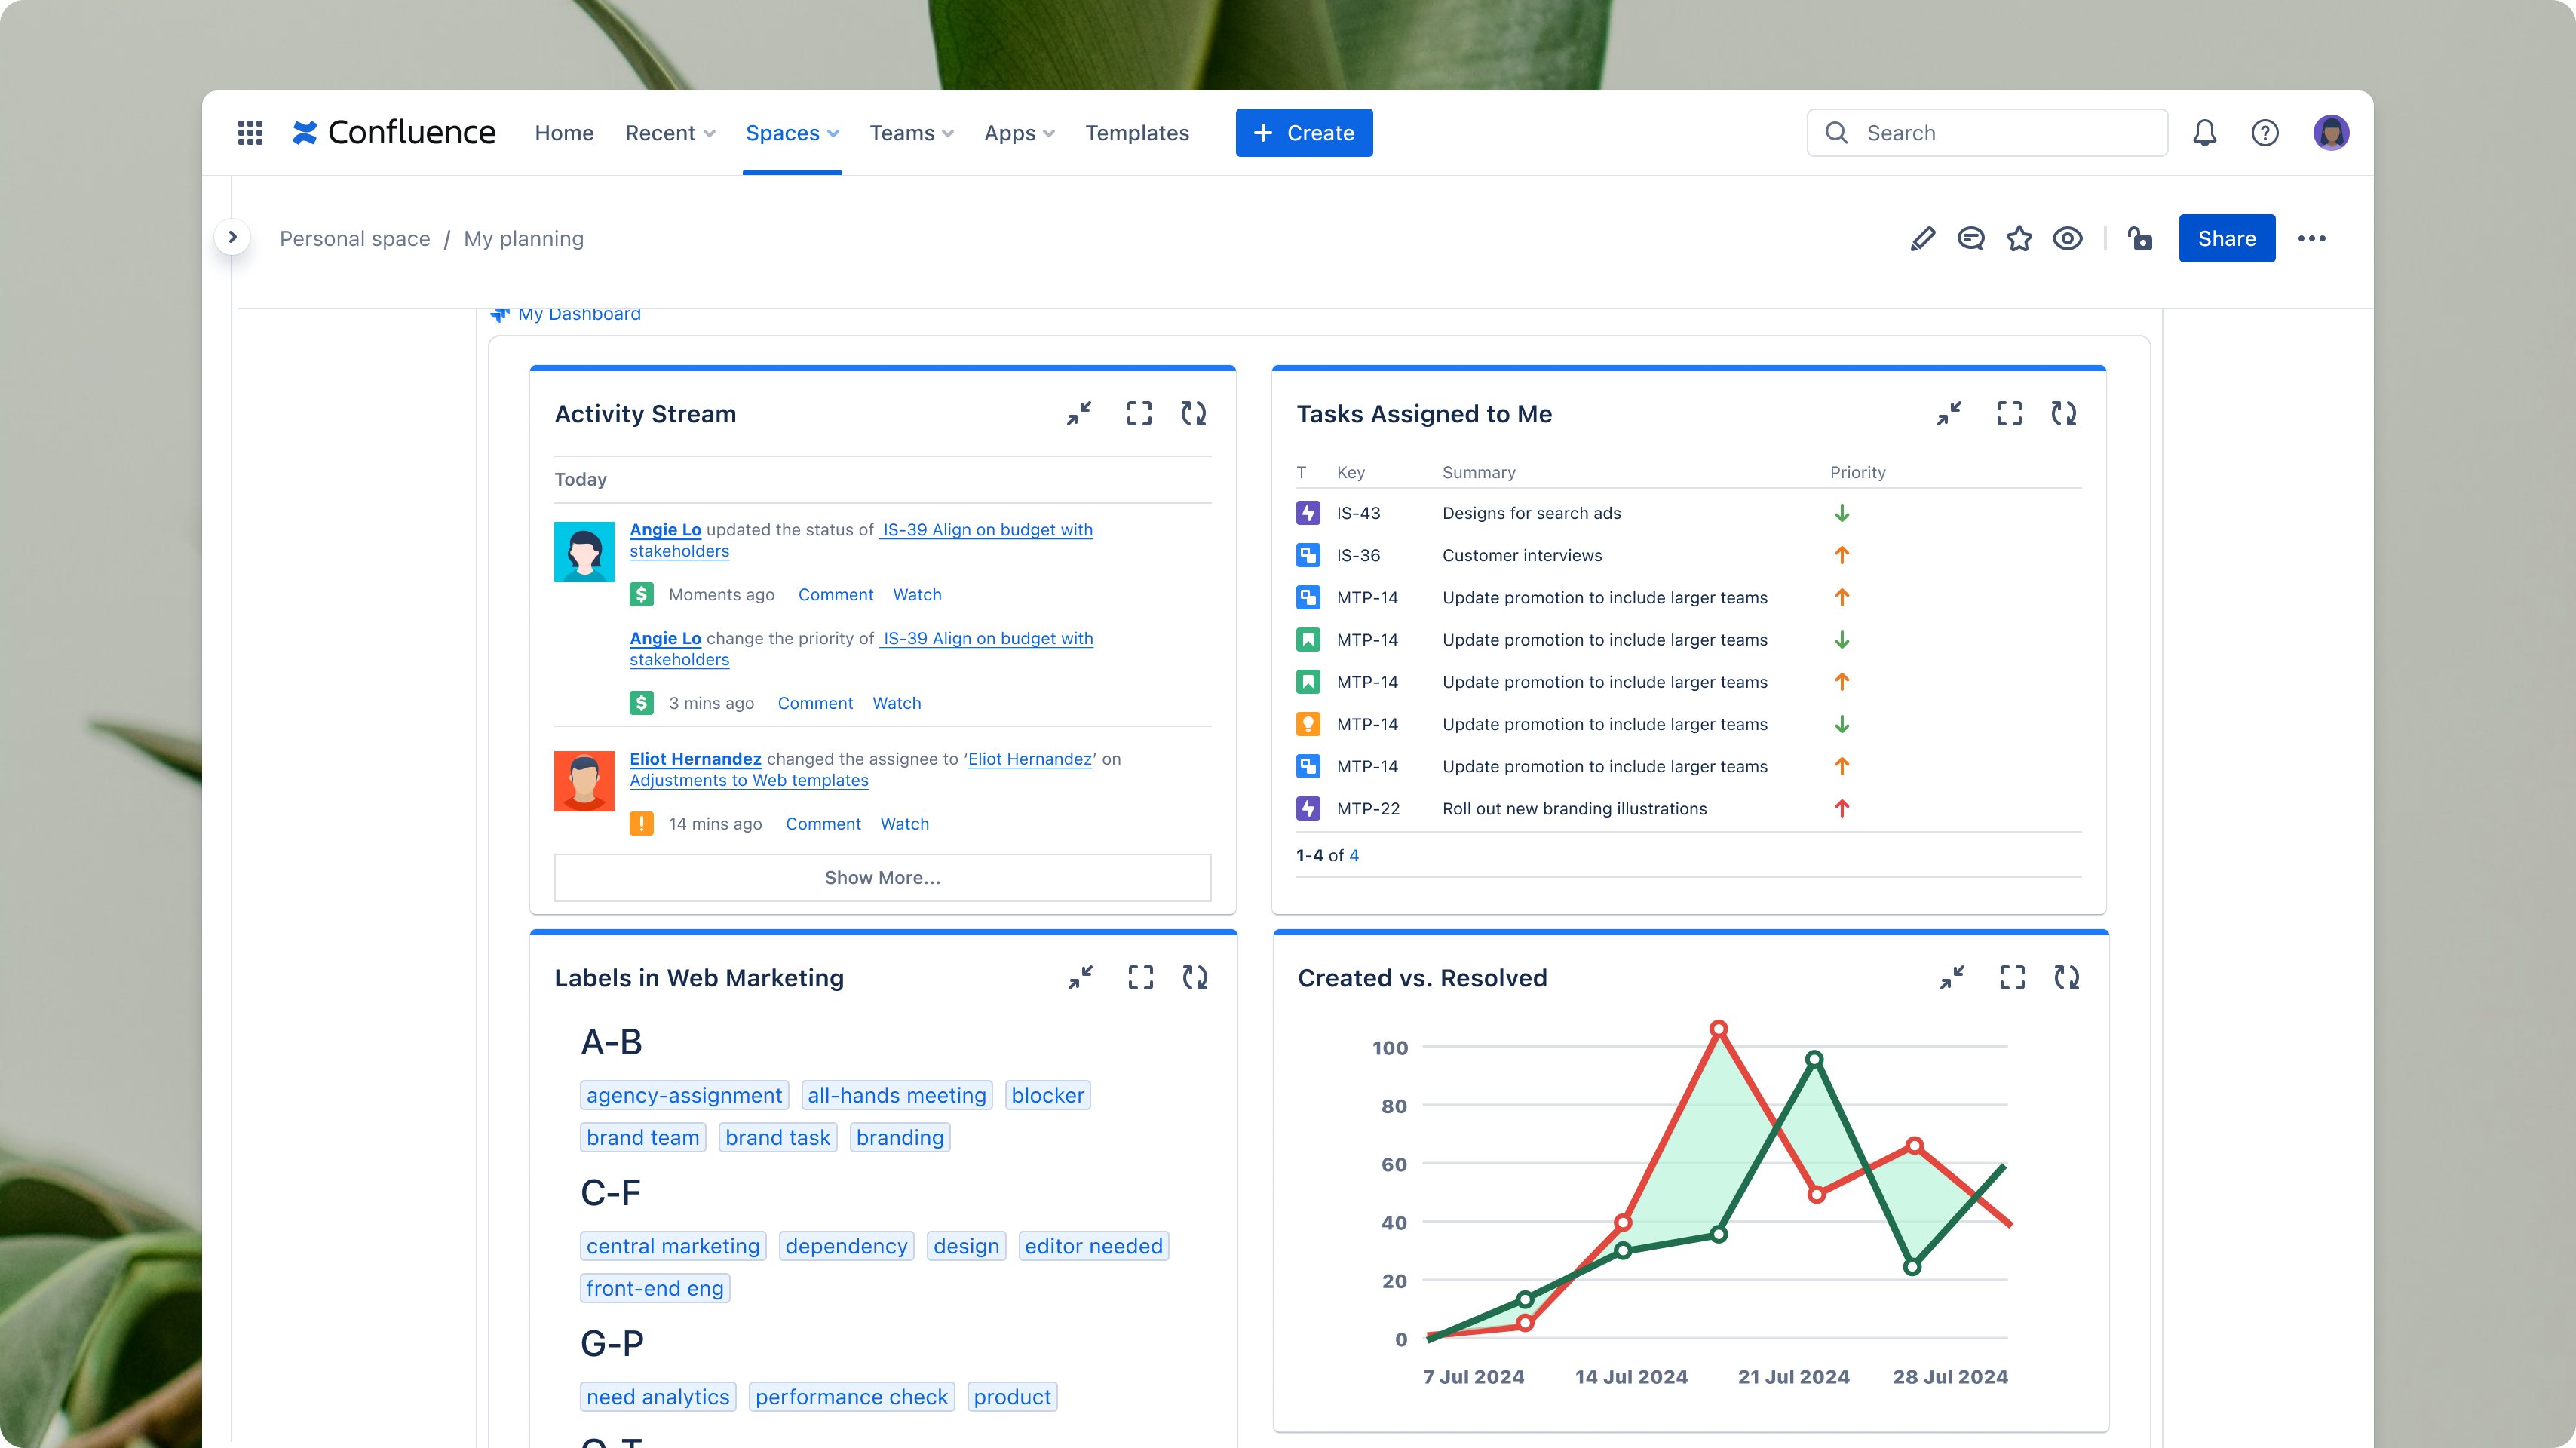
The Confluence + Jira collab makes it possible to create and share interactive and dynamic reports in Confluence using information from Jira. This comes in handy for a variety of purposes, for example:
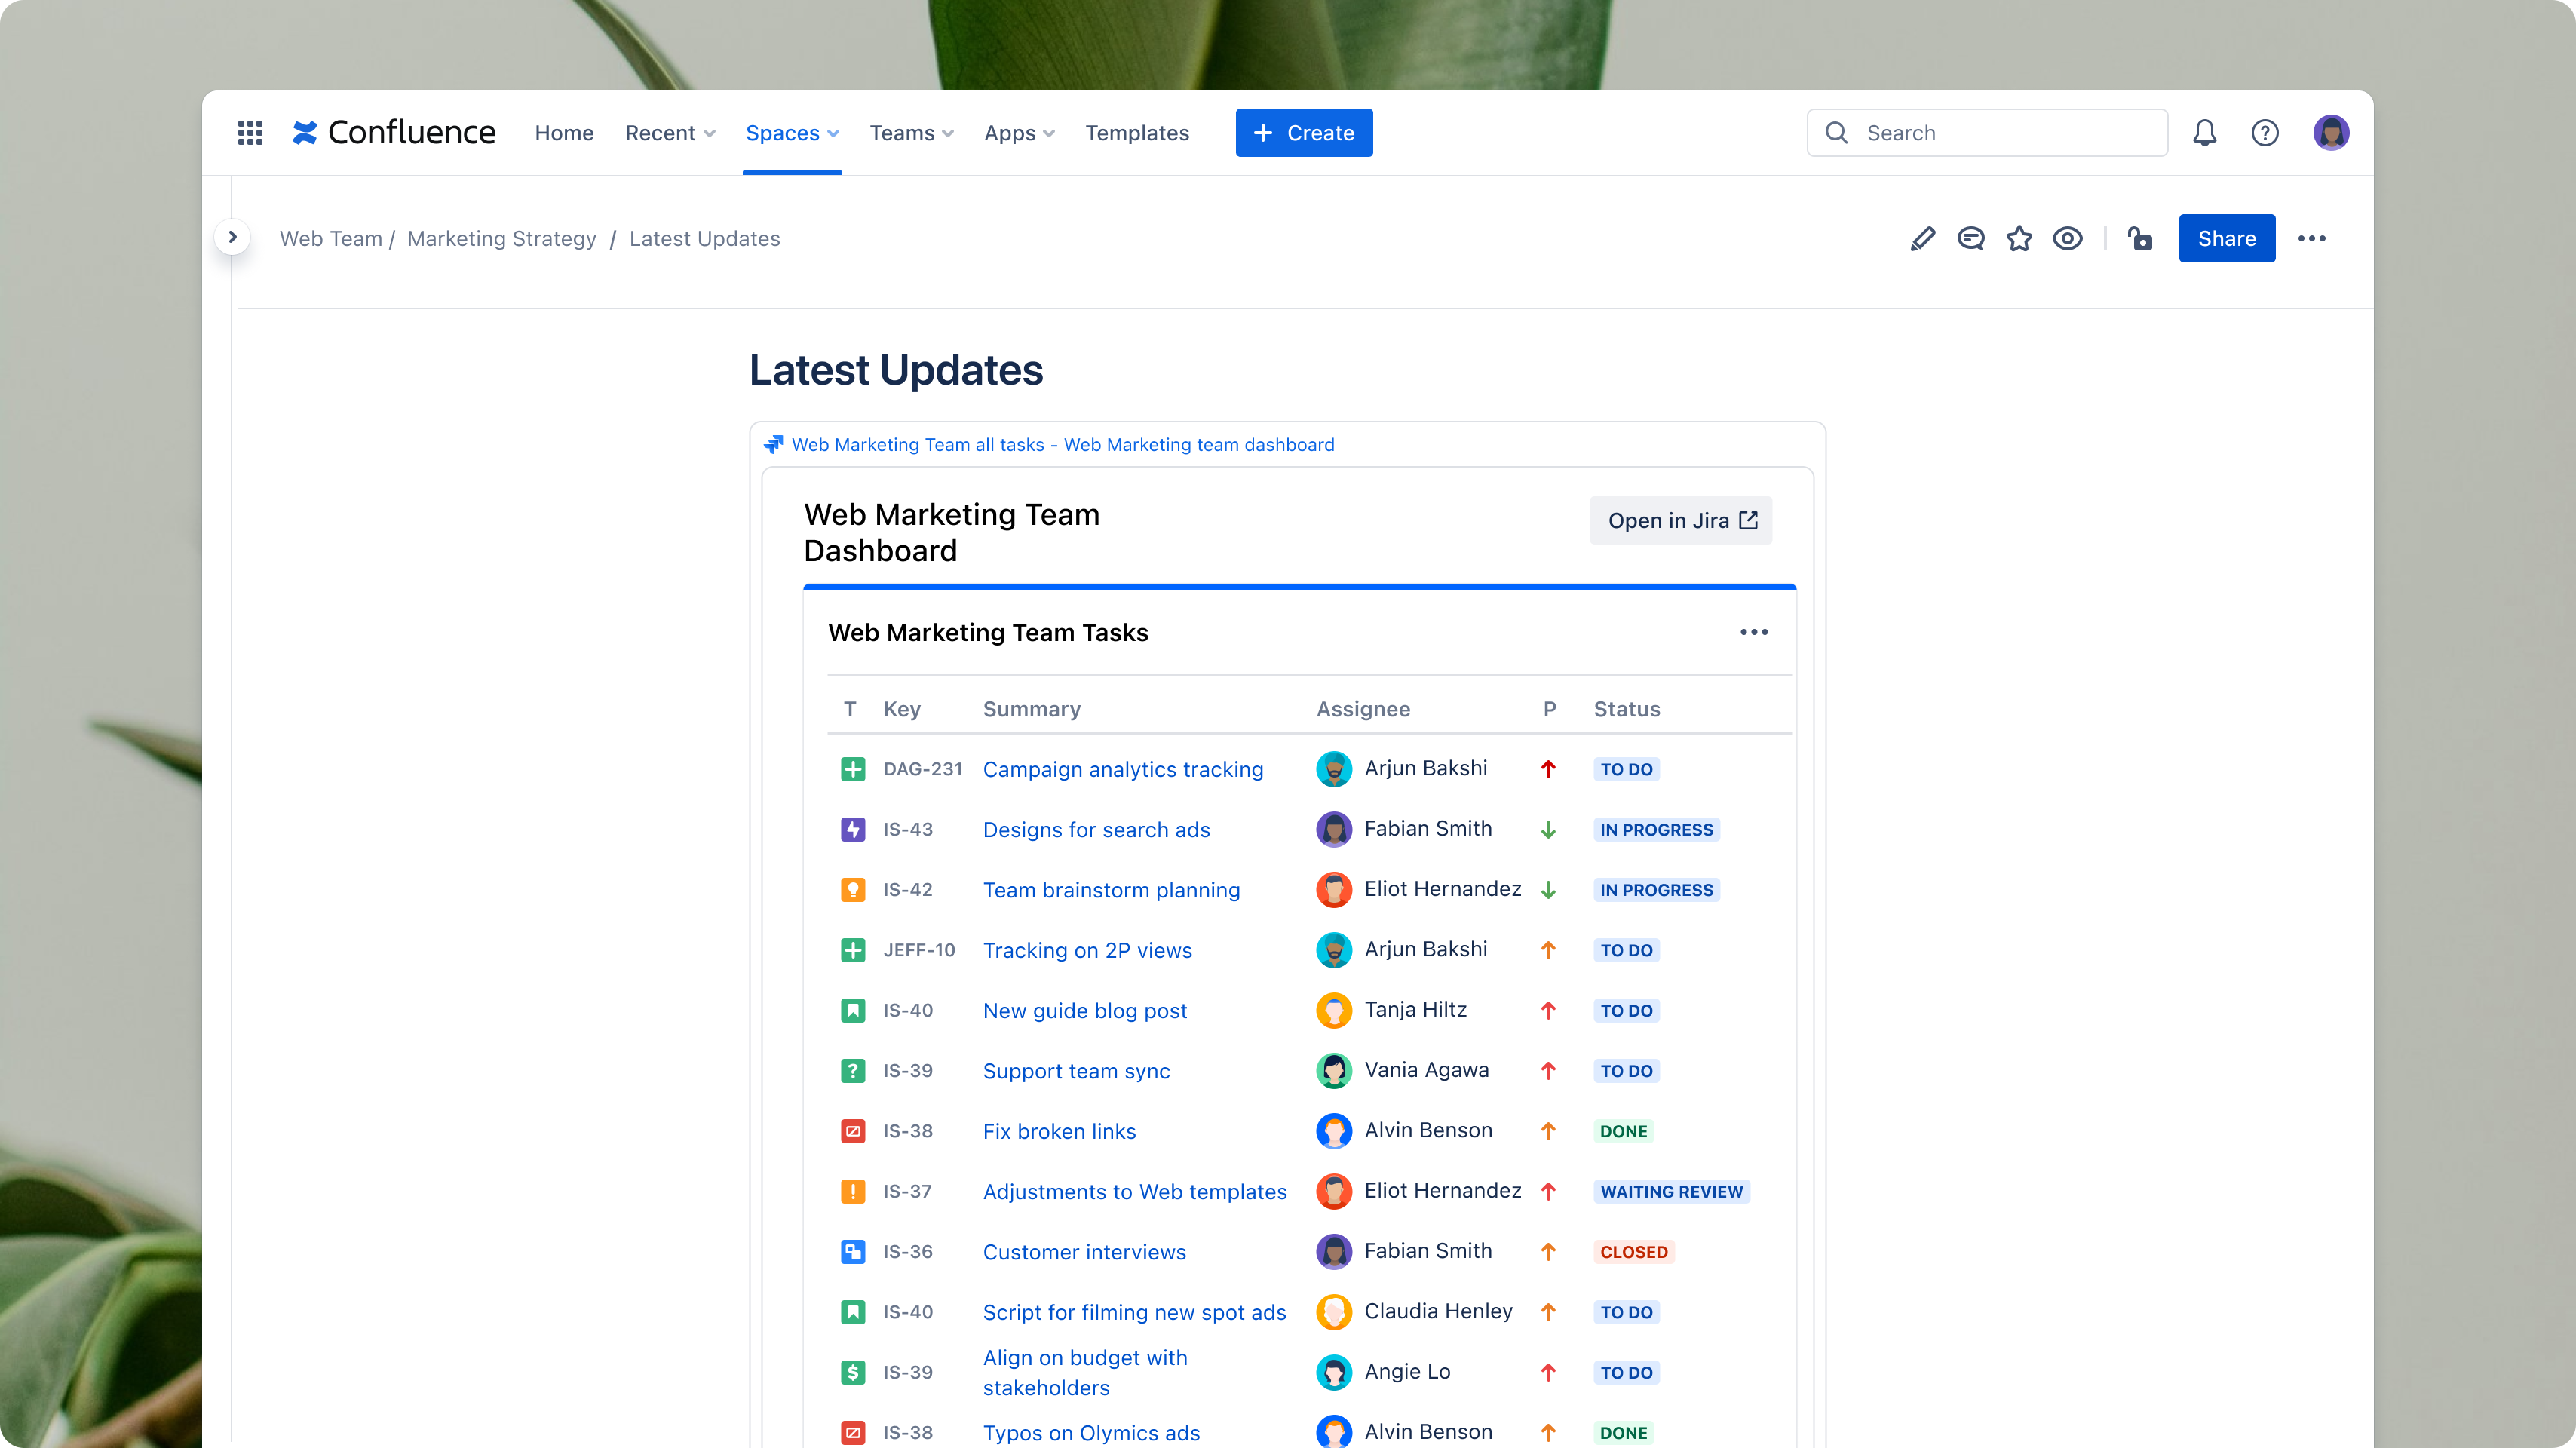
Adding a chart of the in-progress and completed tasks associated with each project on its corresponding Confluence page
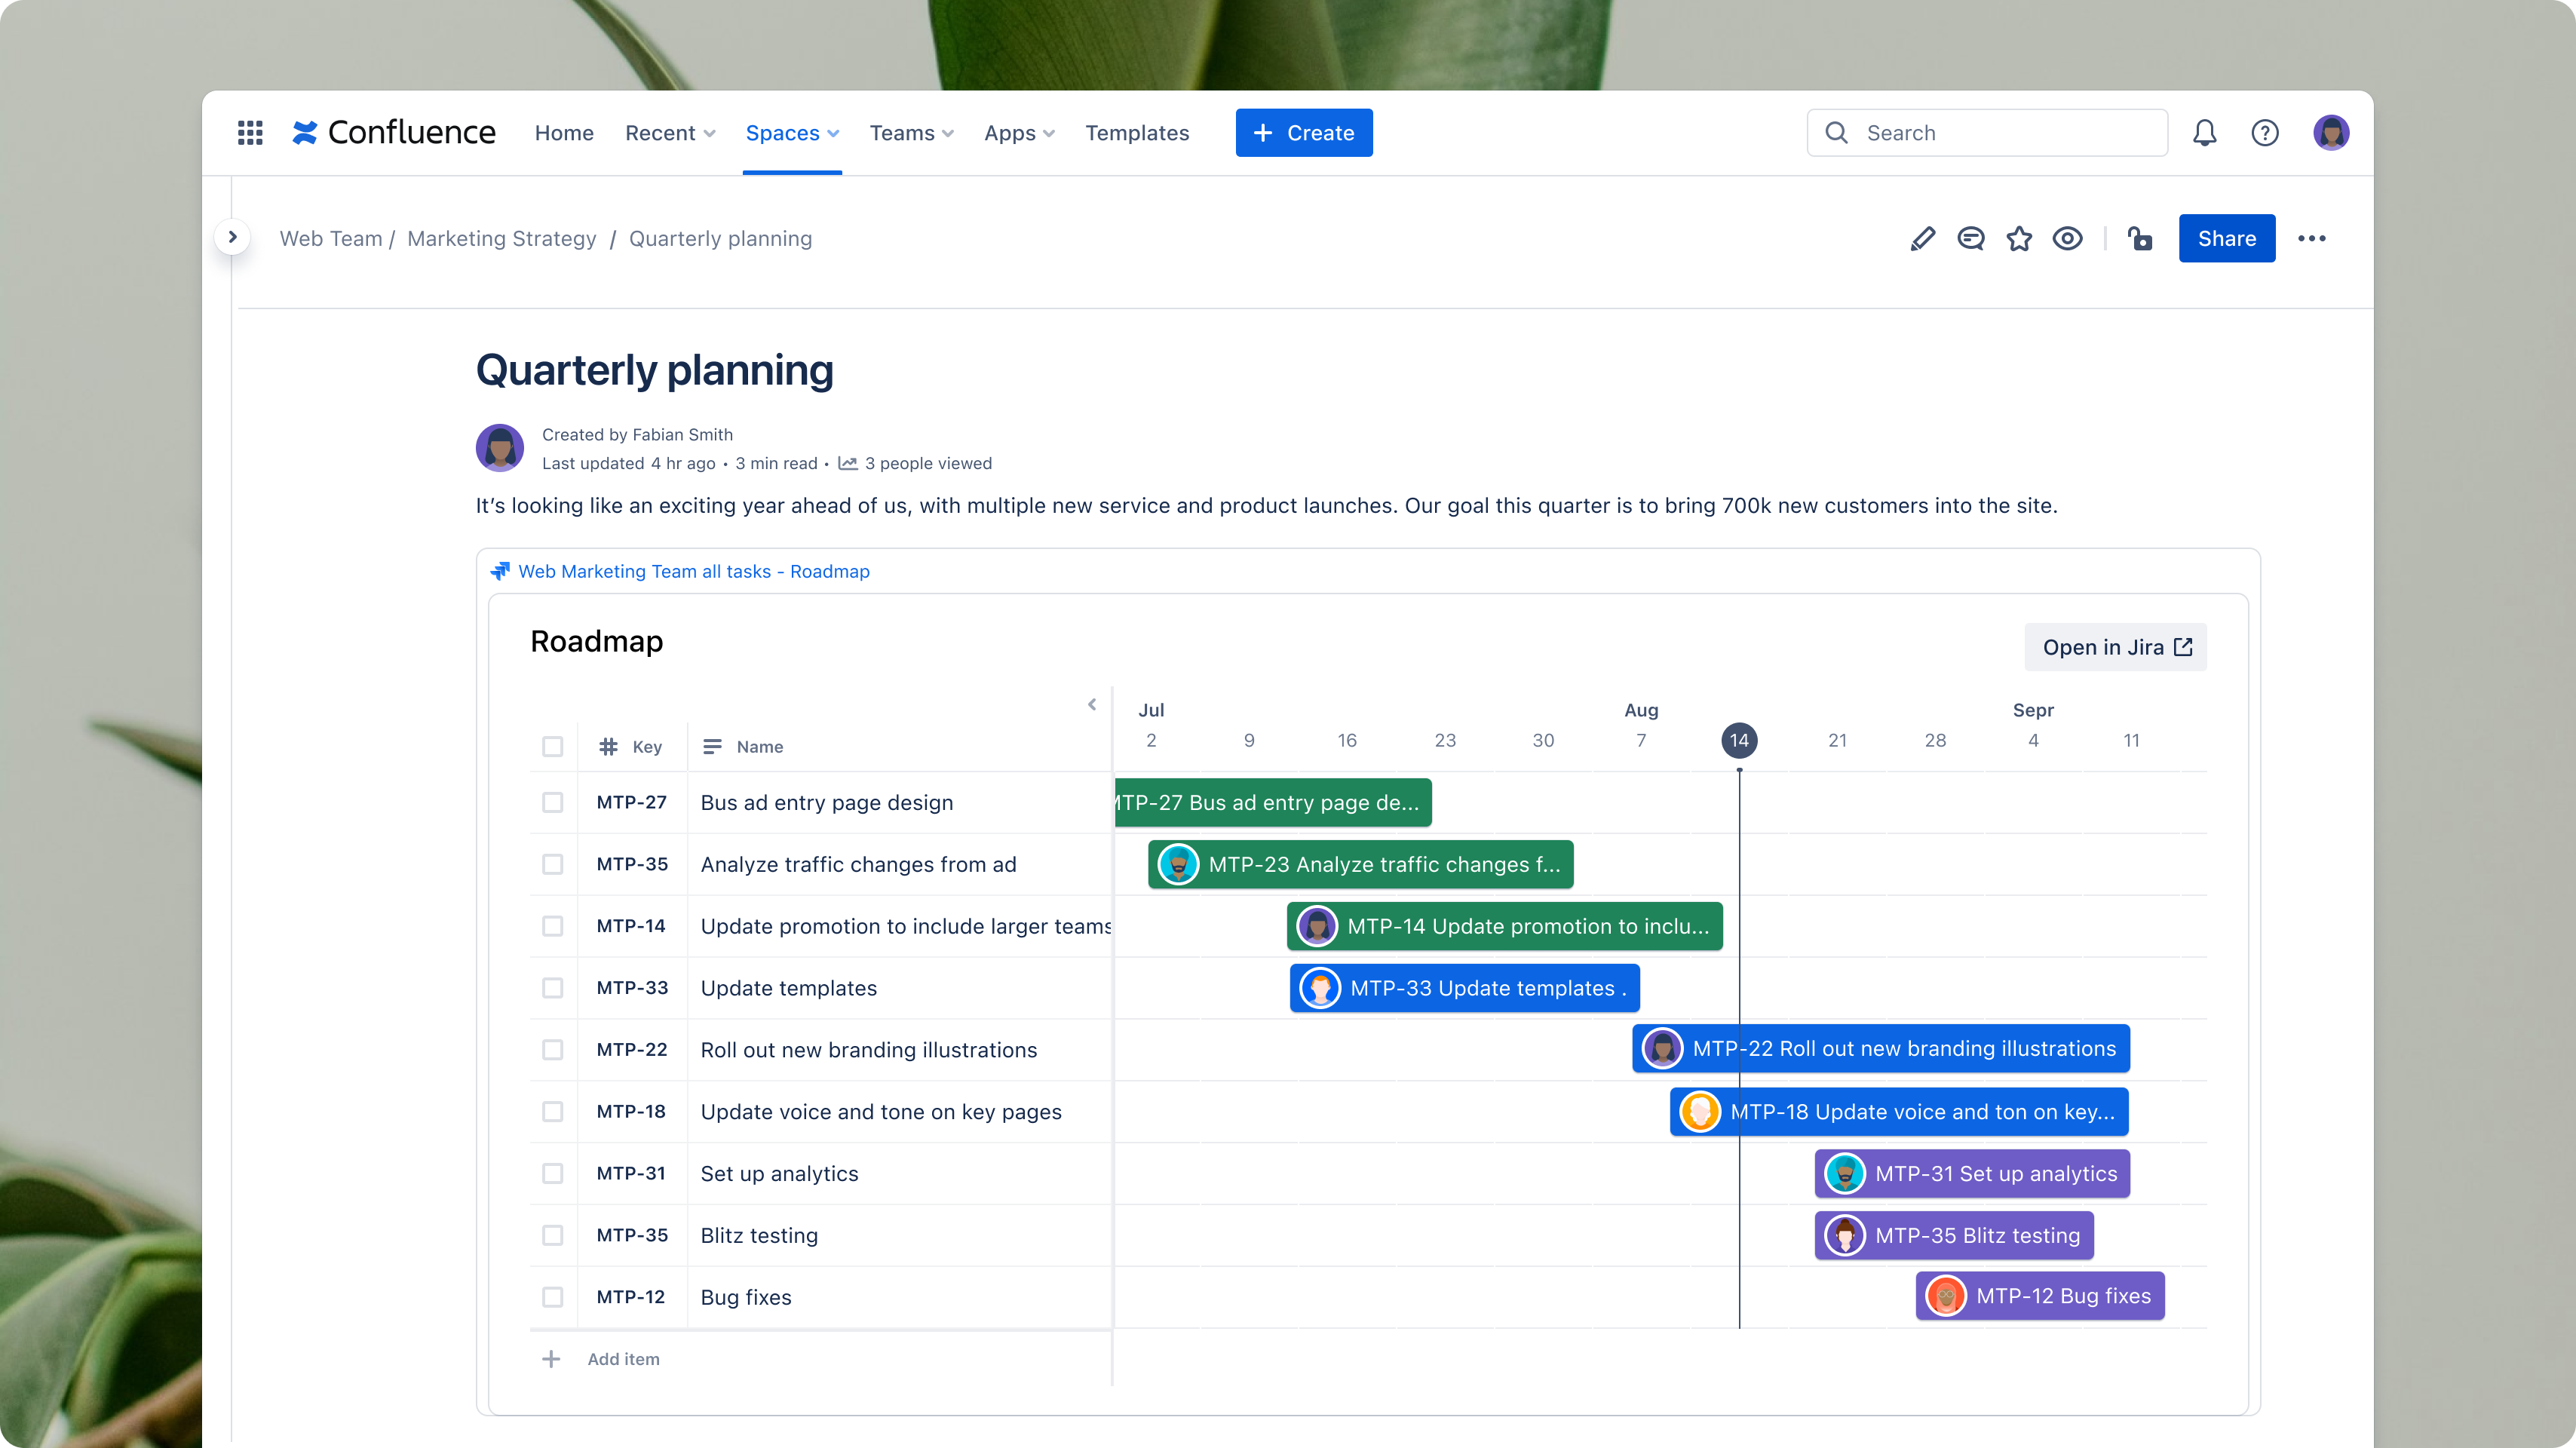
Adding roadmap charts to relevant Confluence pages that show showing the deadlines and milestones for a product release, project, or campaign with a summary of progress made towards each
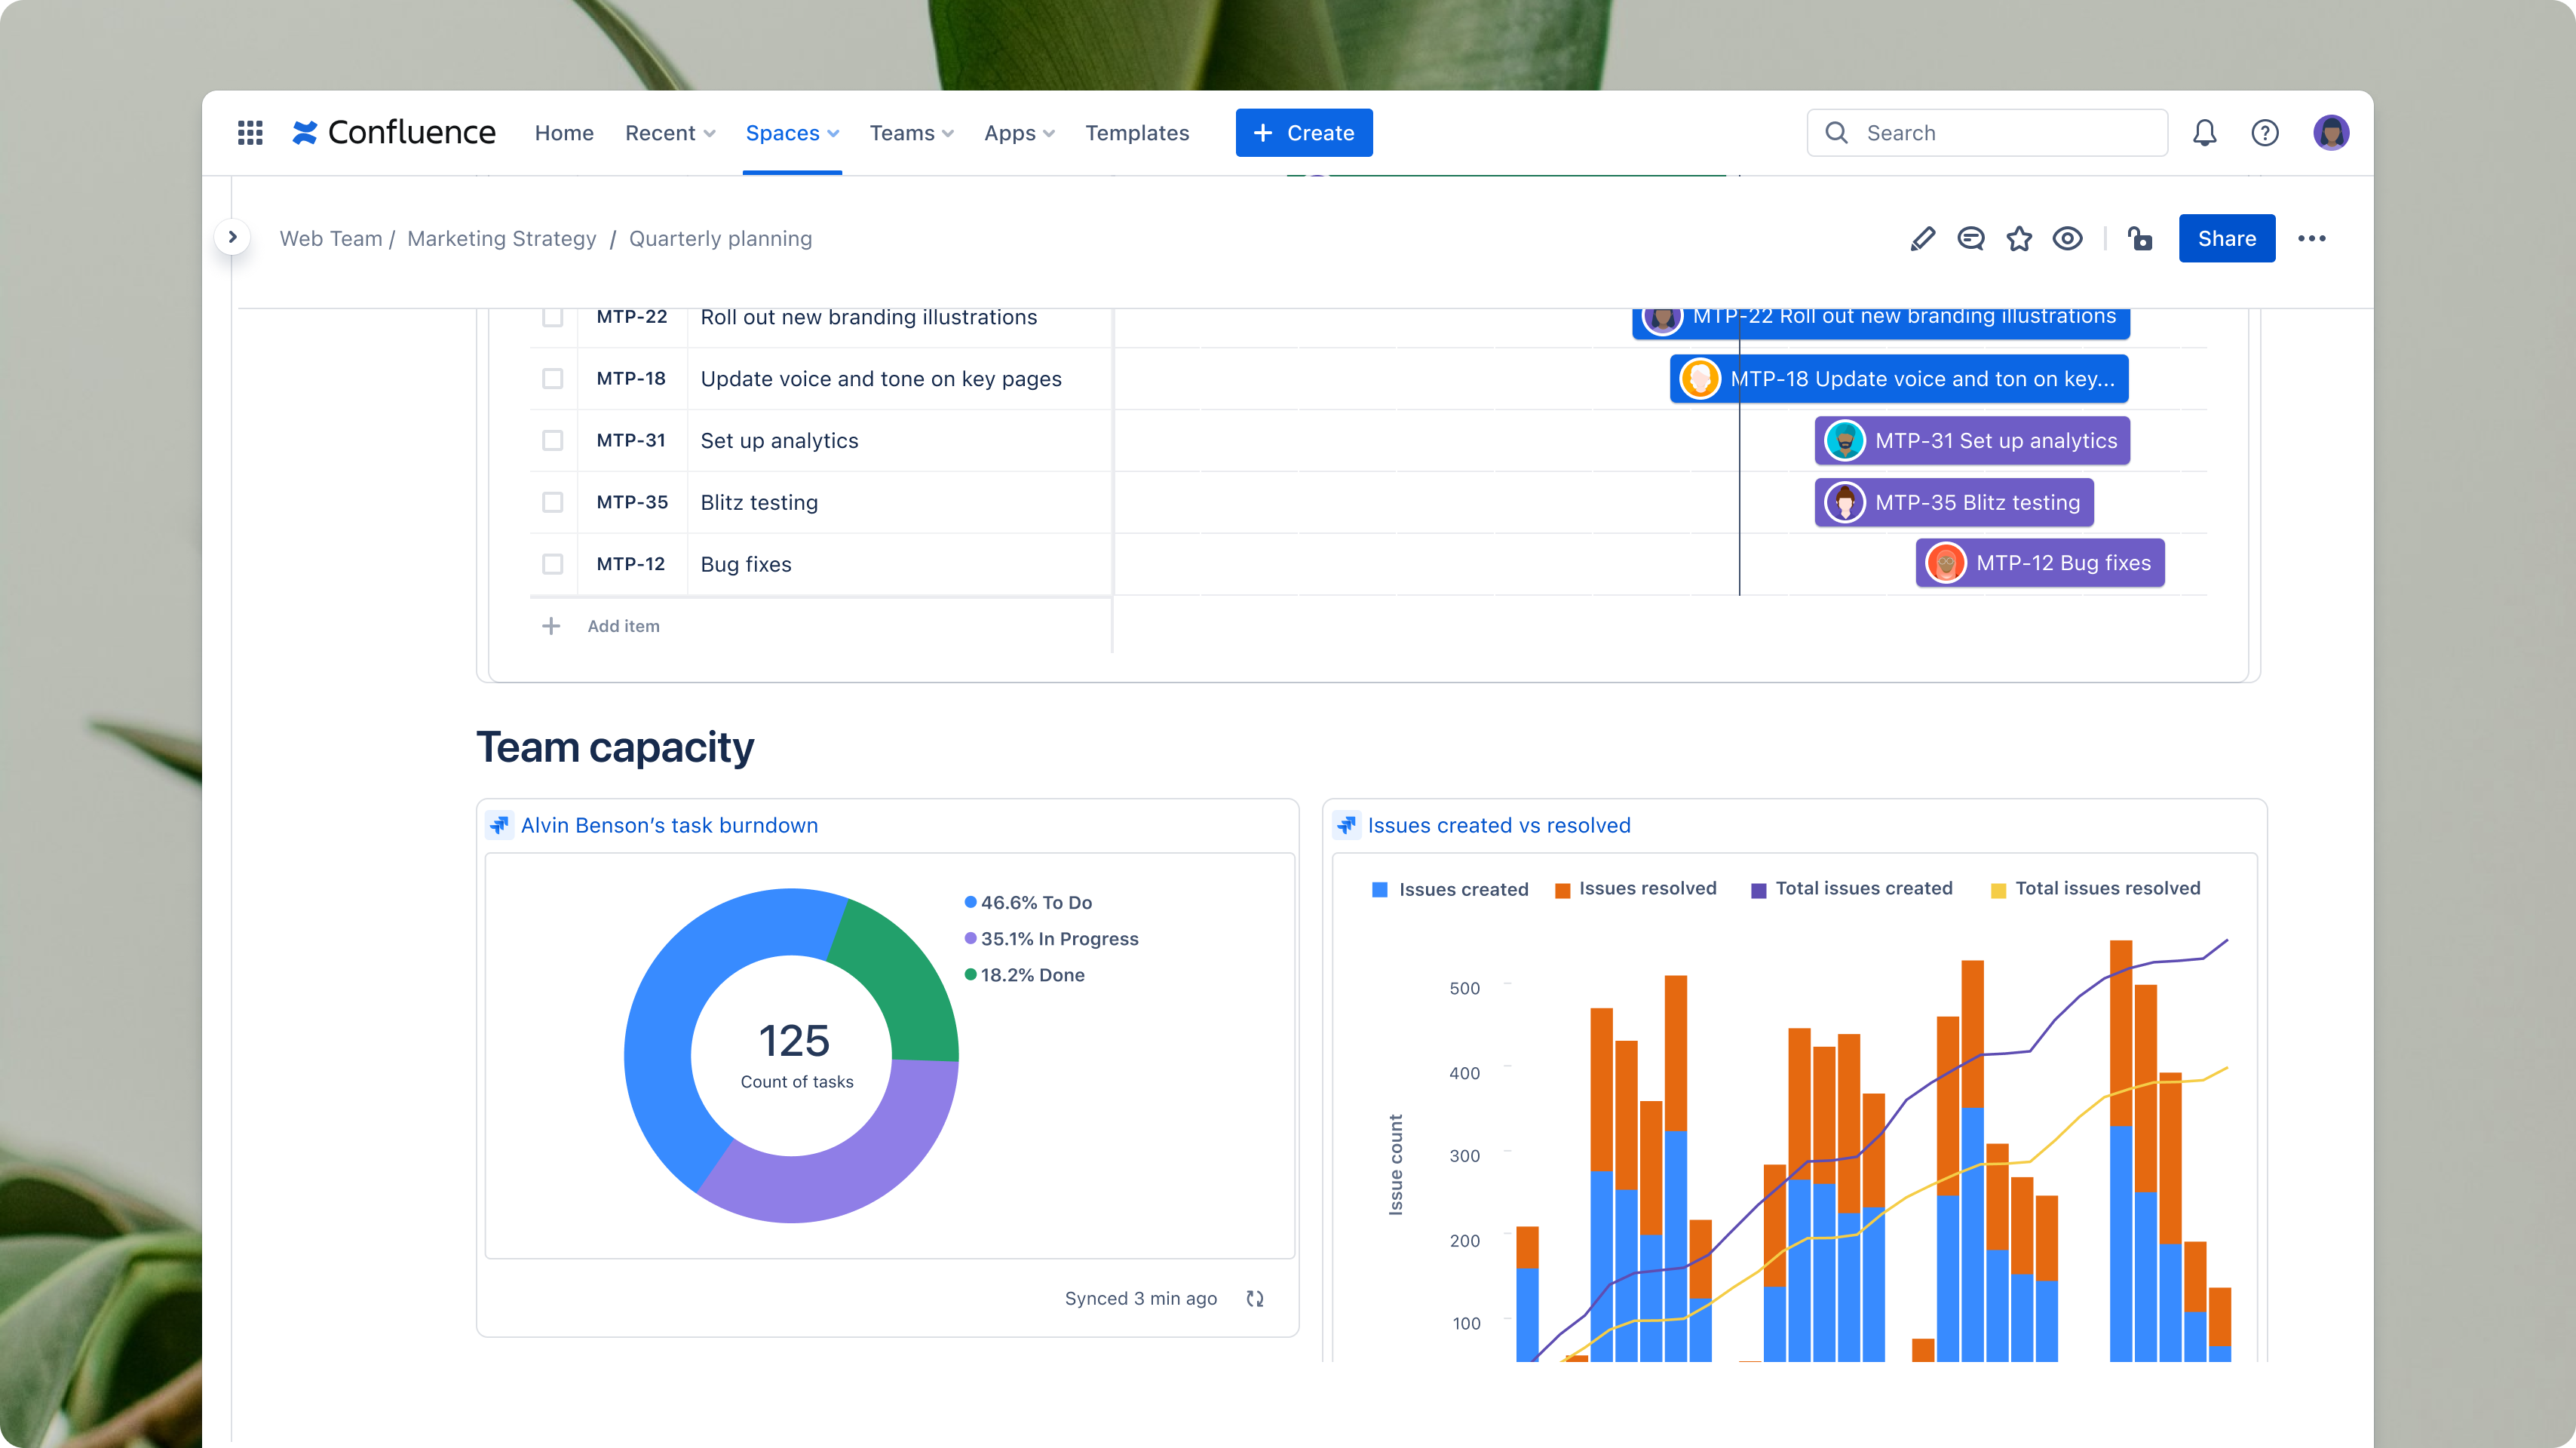
Adding a pie chart of issues associated with a certain category, filtered by different designations, like issue status, priority, or assignee
Now, let’s take a look at a few of the benefits:
Single source of truth with context, commentary, and collaboration
Switching between Jira and other platforms to share progress updates can disrupt workflows, reduce productivity, and lead to misalignment. While Jira contains data and key information you report on, presentations of this data often take place in another tool, and commentary and feedback occur in yet another.
Fortunately, you can eliminate context-switching and fragmented information by simply using Confluence and Jira together. Powered by the Atlassian platform, Confluence and Jira’s native integrations enable data sharing across both tools.
When you use Smart Links to copy and paste live Jira dashboards and widgets in Confluence, you can share them with your team and take advantage of Confluence’s collaboration features. In Confluence, your team can dig into the dashboards, ask questions, add comments, and provide feedback. This workflow ensures your entire team sees the Jira data, project context, and commentary all in one place, leading to better alignment.

Real-time synchronization
Teams need to share reports on their progress and performance with information typically displayed in Jira dashboards. To do this, teams often take screenshots of Jira dashboards or recreate dashboards entirely to share with stakeholders. This workflow causes information to become quickly outdated. Users have to manually update reports, which is a tedious, time-consuming, and error-prone process.
However, pasting a Smart Link of your Jira dashboard into Confluence embeds that content from Jira, so you don’t need to worry about manual updates. As the data changes in Jira, so will the dashboards embedded within your Confluence page.
This integration will reduce confusion about the latest project status. As your projects progress, the most up-to-date information will be reflected across both Jira and Confluence. This simplifies the process of creating and sharing status updates and reports, saving time and reducing errors. You’ll always have the latest project details available, eliminating outdated information and ensuring informed decision-making.
Interactivity at your fingertips
Without the integration of these two tools, static images of dashboards or recreated versions in other tools lose their interactive elements. This makes it hard to delve deeper into data or get detailed insights, forcing you to dig for it in other tools.
Maintain the ability to drill down into charts and graphs for deeper analysis and understanding of project data directly within Confluence. Jira dashboards and gadgets pasted in Confluence retain their interactivity, ensuring everyone has the context and additional details on Jira issues to make informed decisions.
Key features to start creating better reports today
Bring your reports in Confluence to life with real-time synchronized data from Jira. Jira’s interactive data visualizations create more nuanced and sophisticated reports to share with internal collaborators and external partners. Here are the features you need to know to start building better progress and performance reports:
Jira dashboards
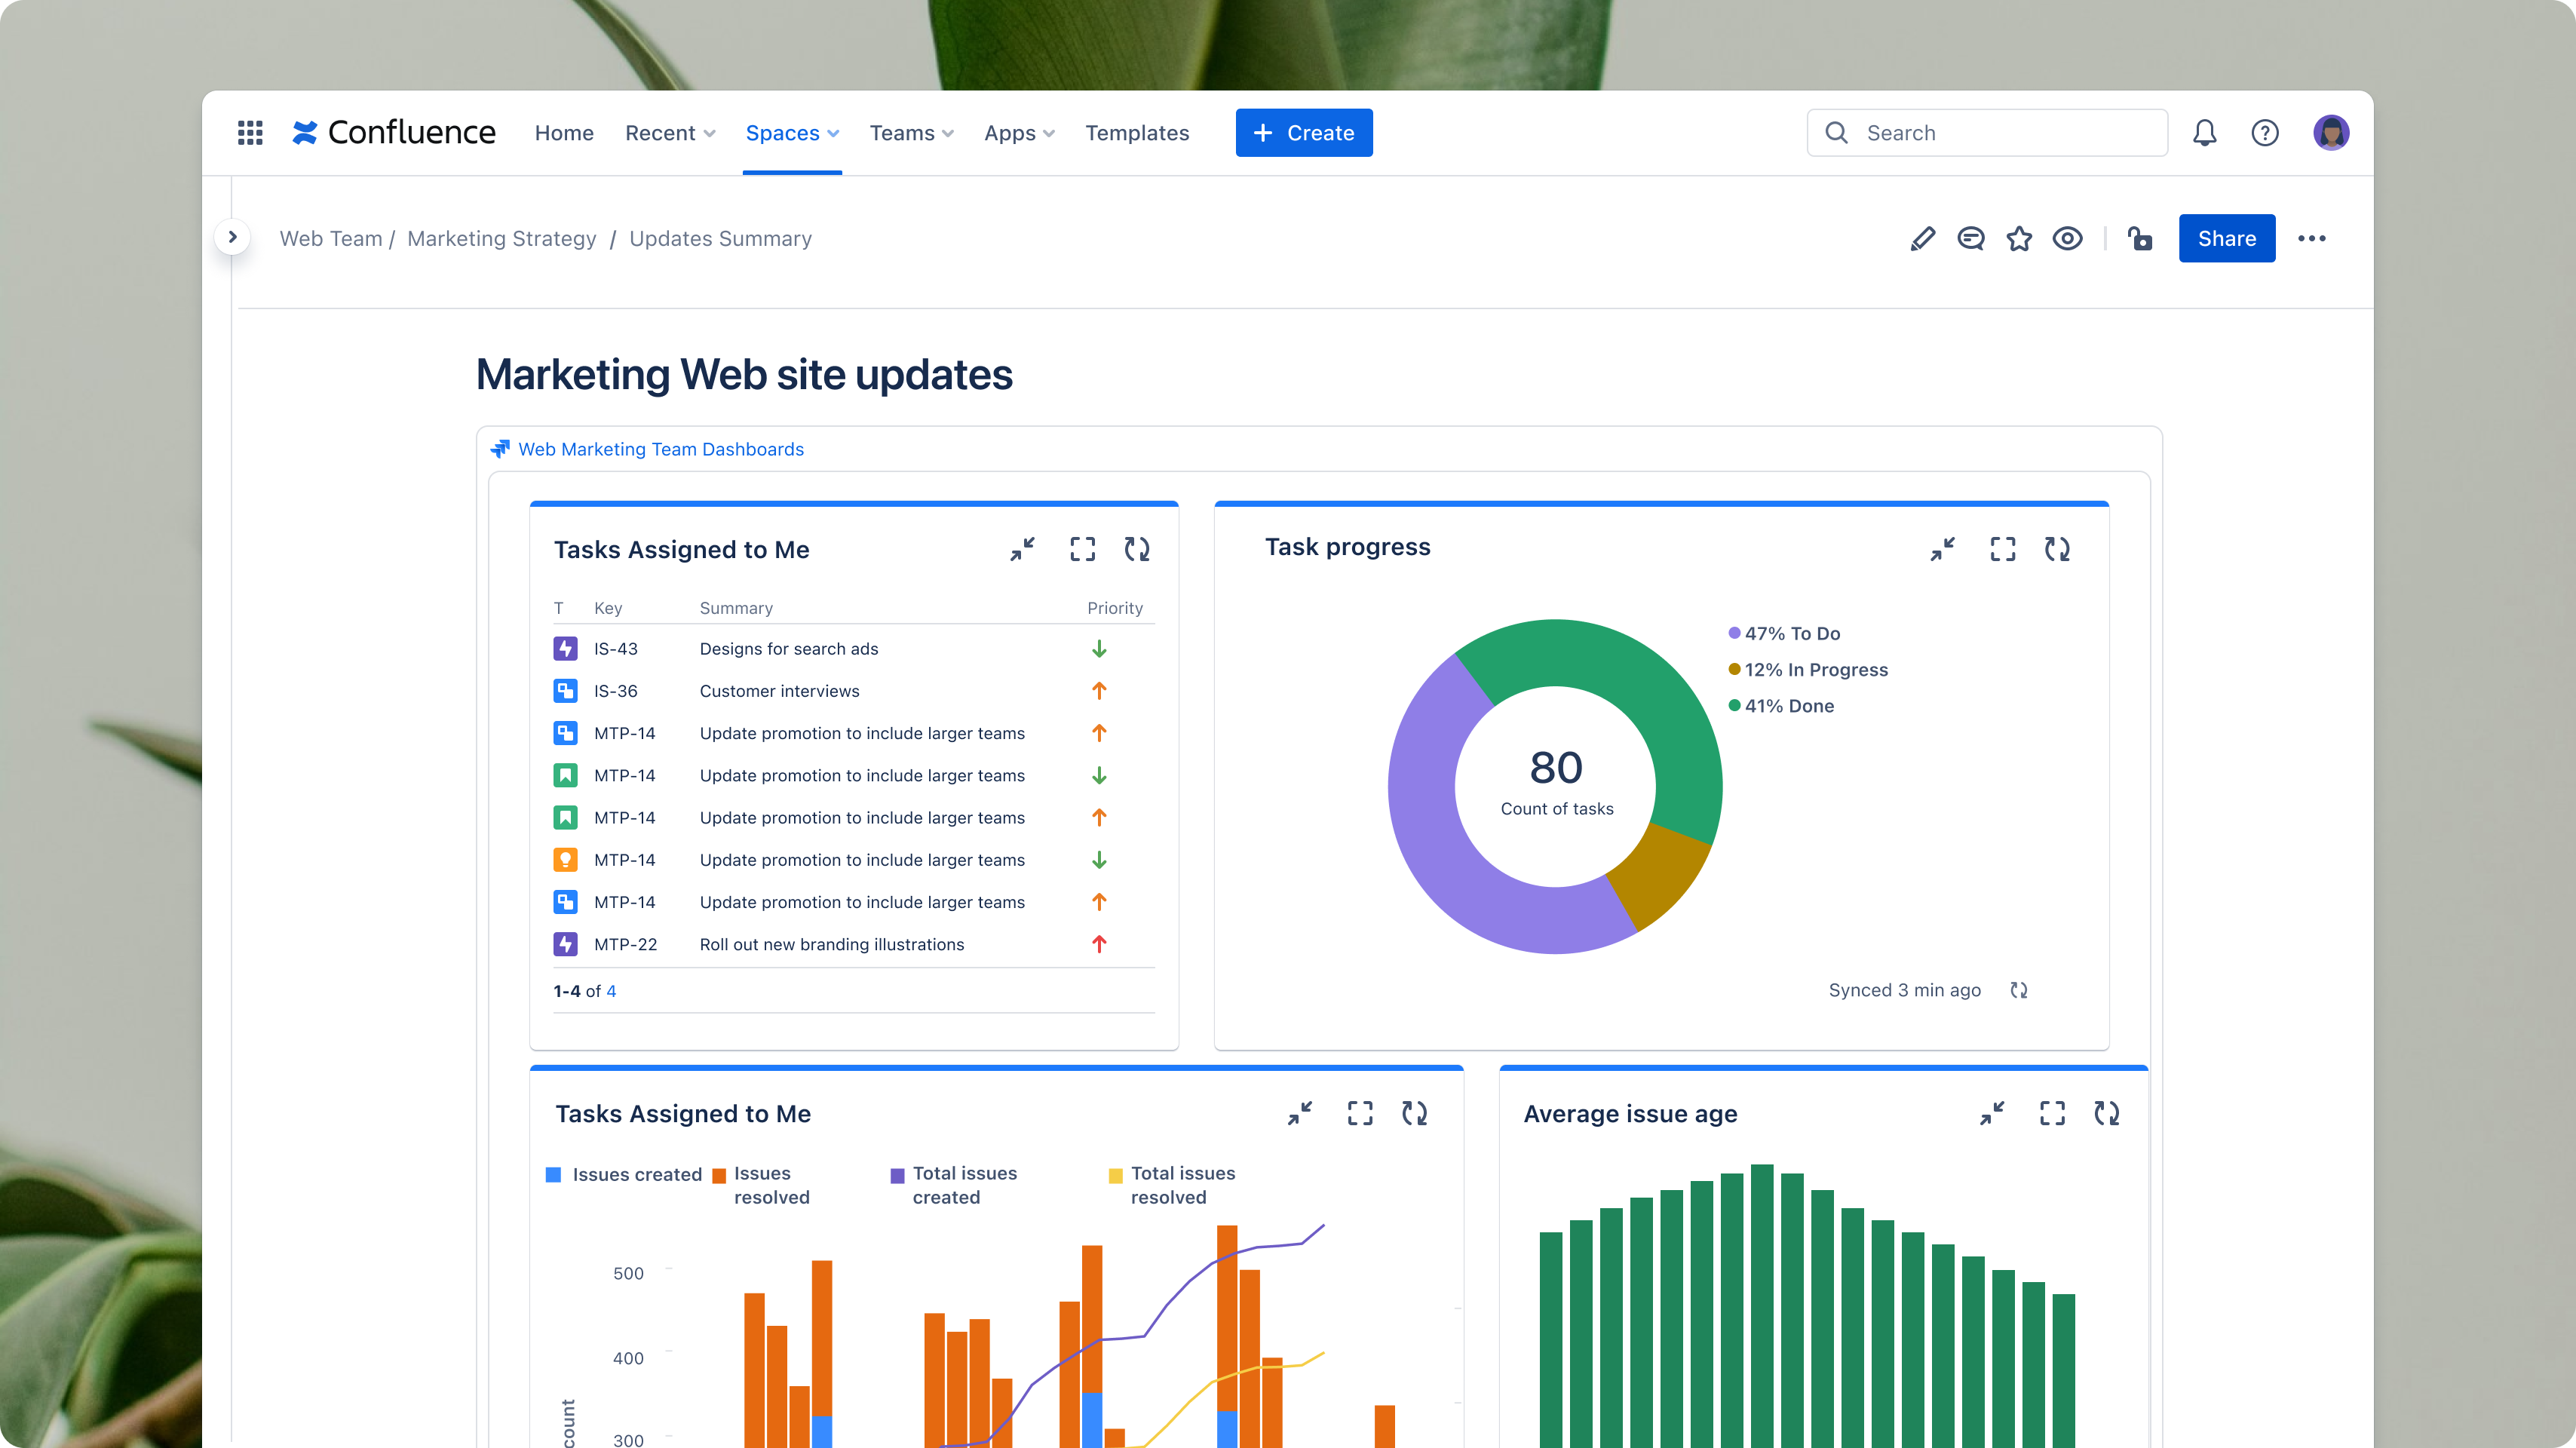
A Jira dashboard is a customizable display interface that users see when they log in. It offers a streamlined view of your team’s projects and tasks. You can create multiple dashboards to manage different projects or consolidate all your work into a single, expansive overview.
Dashboards contain gadgets that display charts, graphs, and other reporting elements you can add to Confluence pages.
Jira gadgets
Jira gadgets can be used to add charts and graphs to your Jira dashboard. You can customize the kinds of gadgets you want displayed or choose from standard preset gadgets. Some of the pre-programmed gadgets include:
- Two Dimensional Filter Statistics: Display statistics of issues returned from specified filter
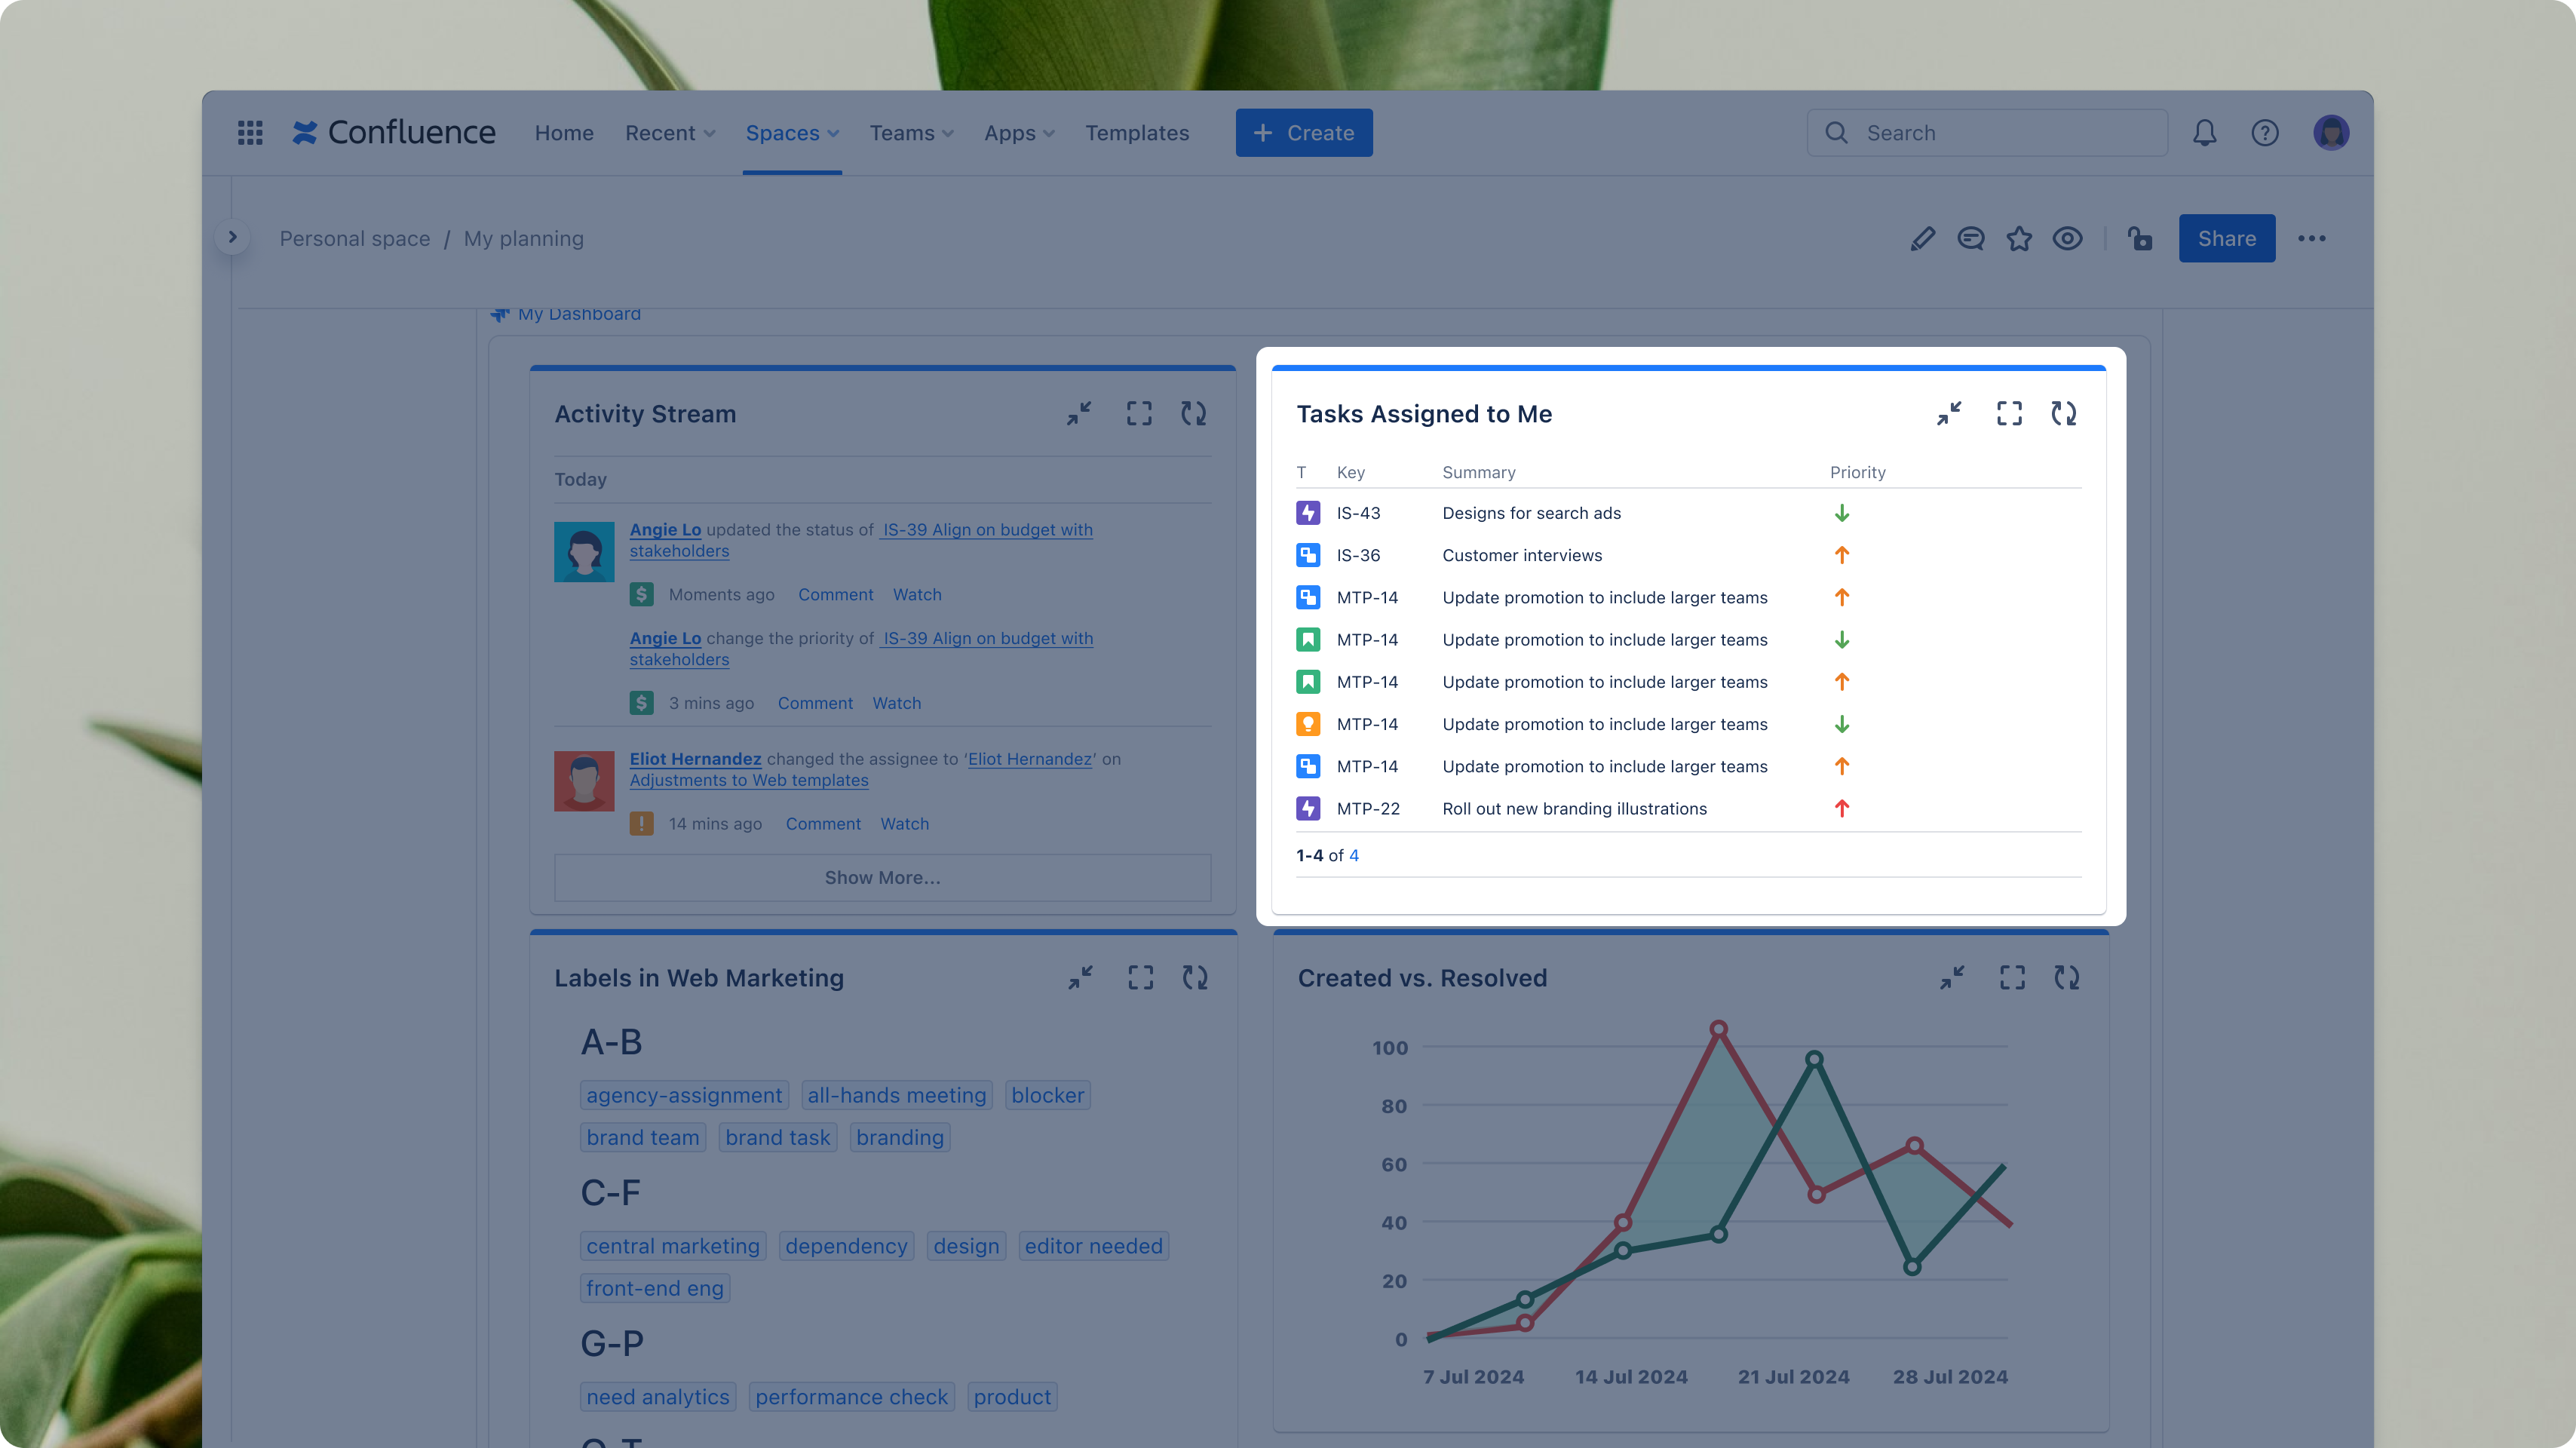
- Assigned To Me Gadget: The open issues assigned to the logged-in user
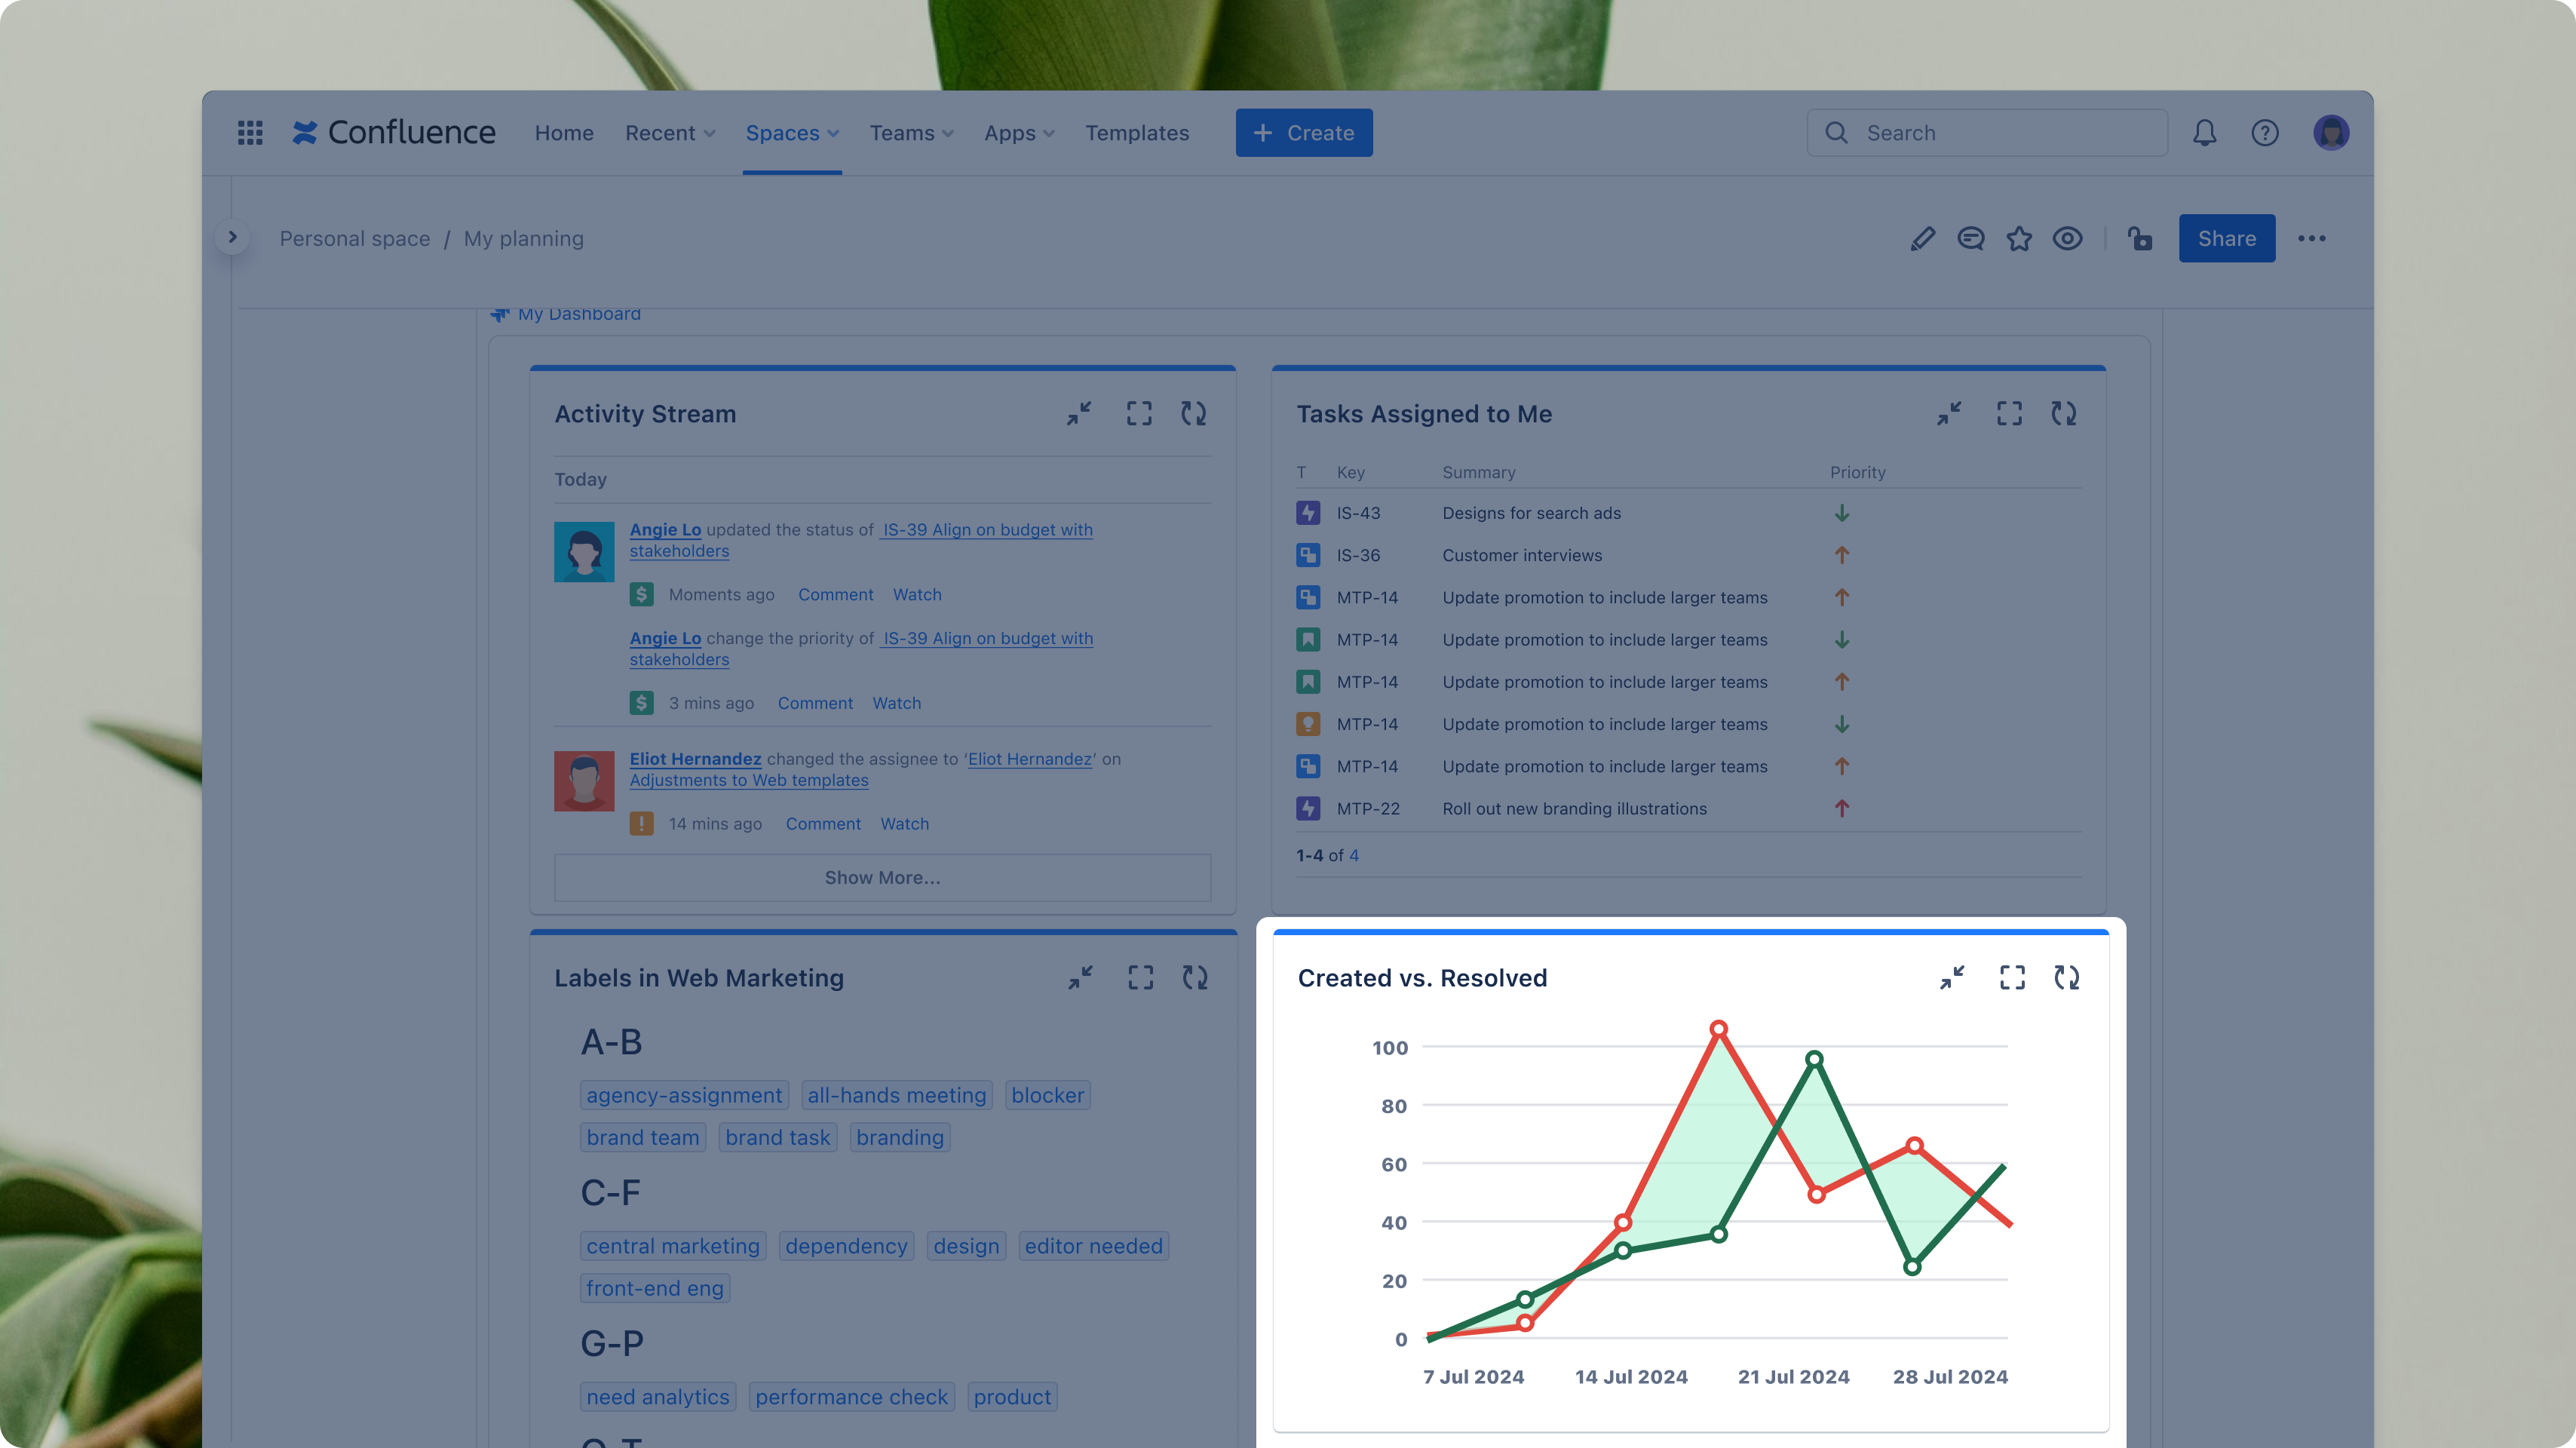
- Created vs. Resolved Gadget: A chart of how many issues have been created compared to how many have been resolved over a selected period
Smart Links
Smart Links are rich hyperlinks that display the main content from the linked source right on the page where the link is. Now, Smart Links support Jira dashboards and individual gadgets so you can embed them in Confluence pages. With Smart Links, you can still interact with the content, so no information is lost from the original.
Confluence Pages
Pages are living documents where your Confluence content is stored. You can create your own pages for anything you need, from meeting notes to status updates, project outlines, timelines, process guides, blog posts, internal policies, and data reports. There are plenty of templates you can choose from if you don’t want to start from scratch.

Confluence Presenter Mode
Confluence’s Presenter Mode enhances content presentation capabilities by minimizing distractions and offering a cleaner, more focused full-screen view. This mode hides side panels, option menus, and in-line comments for a more streamlined presentation of reports.
Users can navigate through the content with intuitive keyboard controls or arrow buttons, which highlight sections based on headers, tables, and layouts. Presenter Mode provides a better user and viewer experience and allows you to direct attention to precise areas of focus.
To recap, the major benefits of using Confluence and Jira together for progress and performance reports include:
- Quickly add context and share automatically updated reports within relevant Confluence pages
- Have everything you need in the same place, whether that’s Confluence or Jira
- Share evolving Jira data with stakeholders in scannable and easy-to-read Confluence pages
- The “copy and paste” convenience makes workflows more efficient and streamlines communication, reducing extra time spent on aligning with collaborators
Transform your reporting with Confluence and Jira
Experience the dynamic duo in action for yourself. Test out Smart Links for dashboards and gadgets to seamlessly bring rich content from Jira to Confluence and start building stronger reports and status updates.
Learn more about the possibilities of Confluence and Jira integrations for better work