As Jira Cloud grows to support larger and more complex customers, so does the configuration that powers their work: custom fields, work types (formerly issue types), screens, schemes, and workflows. Over time, many of these entities become unused or redundant. The result is configuration sprawl—slower experiences, heavier data shapes, and higher admin overhead.
To scale Jira to 100k+ users and beyond, we have introduced limits and guardrails on configuration entities, for example:
- Up to 700 fields per space
- Up to 150 work types per space
- Up to 20,000 field options per field
- Up to 50 issue security levels per space
- Up to 50 grants per permission
- …and limits around versions, workflows, components and priorities
These limits protect and improve core experiences(like view or search work items), but they also create a new problem: how do we help customers get under the limits without breaking their setups?
This is where optimisation tools for Jira come in.
In this blog, I’ll walk through how we designed and built optimisation tools for fields, work types as well as other configuration entities mentioned above — covering reporting, bulk remediation, safety mechanisms, and how these optimisation tie into Site Optimiser and limits enforcement to improve Jira performance at scale. Site Optimiser is the Jira admin experience that surfaces configuration issues and improvement opportunities across spaces.
High-level overview
Optimisation tools are a set of Jira admin experiences and backend workflows that help customers:
- Understand how many configuration entities(fields and work types) are actually used
- Identify unused or low‑value entities that can be safely removed
- Remediate configuration bloat via bulk actions, with safety, audit-ability and rollback
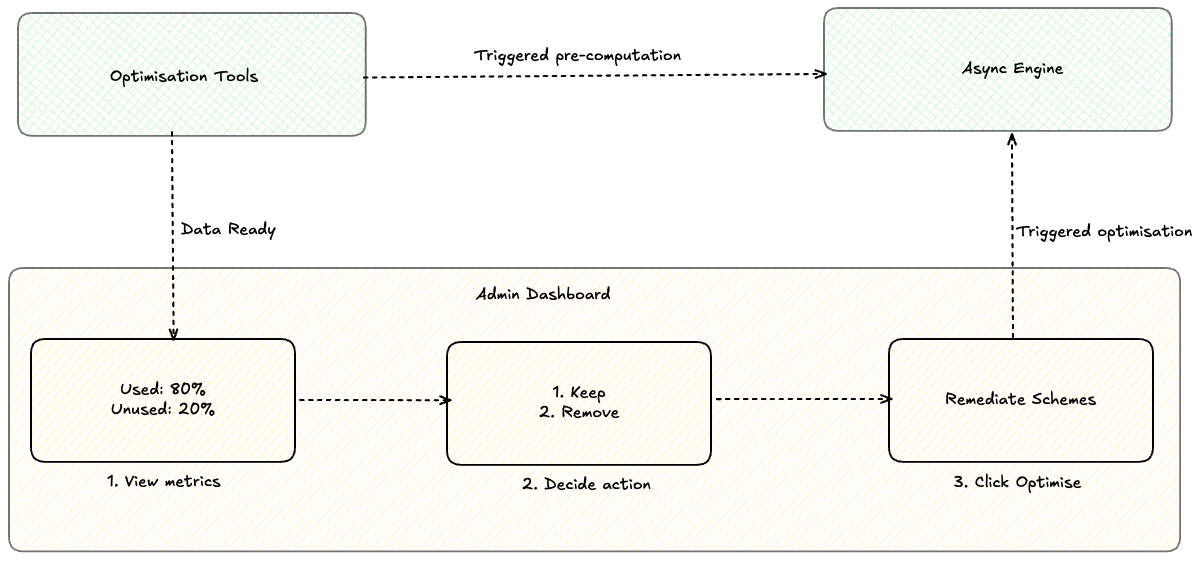
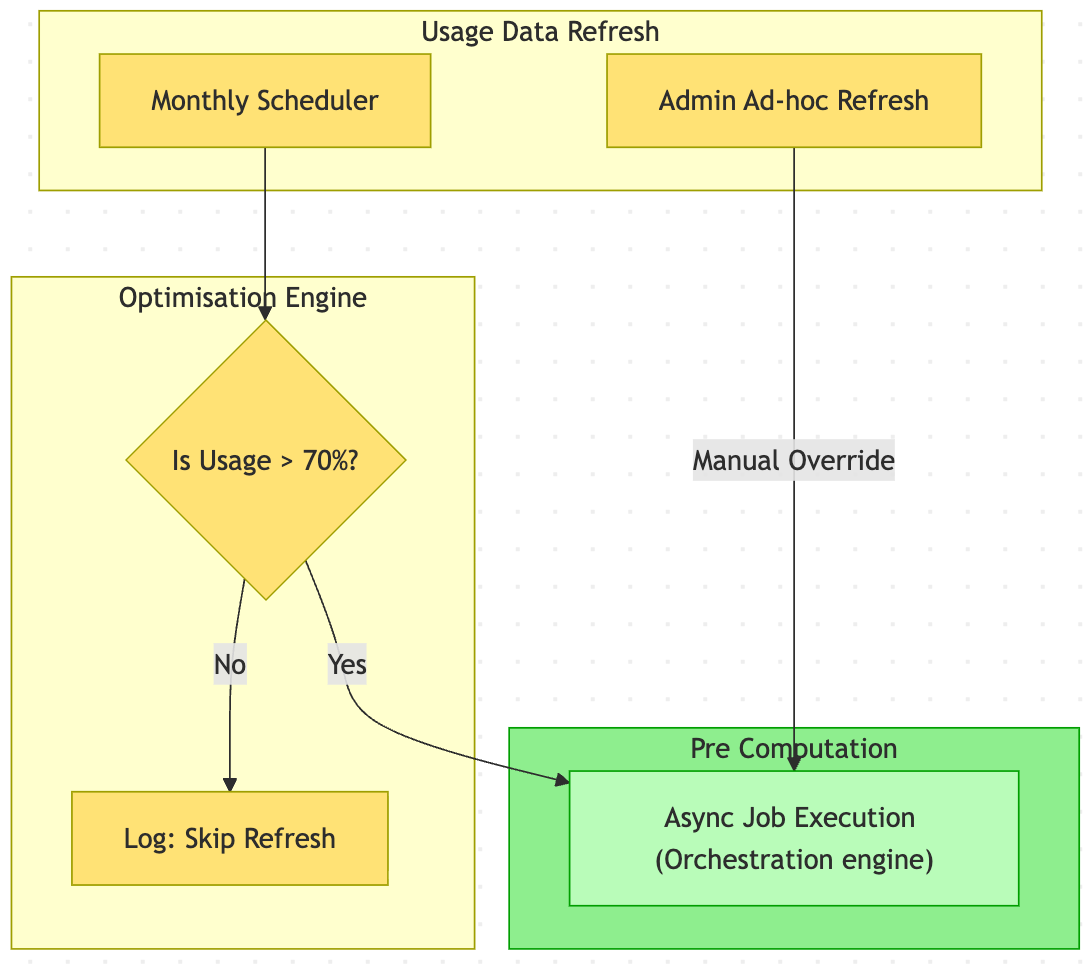
- Jira optimisation tools periodically compute per-spaces entity usage data asynchronously .
- An admin visits entity configuration or site optimiser to view the configuration entity usage report.
- The admin reviews usage insights to see which entity are used or unused.
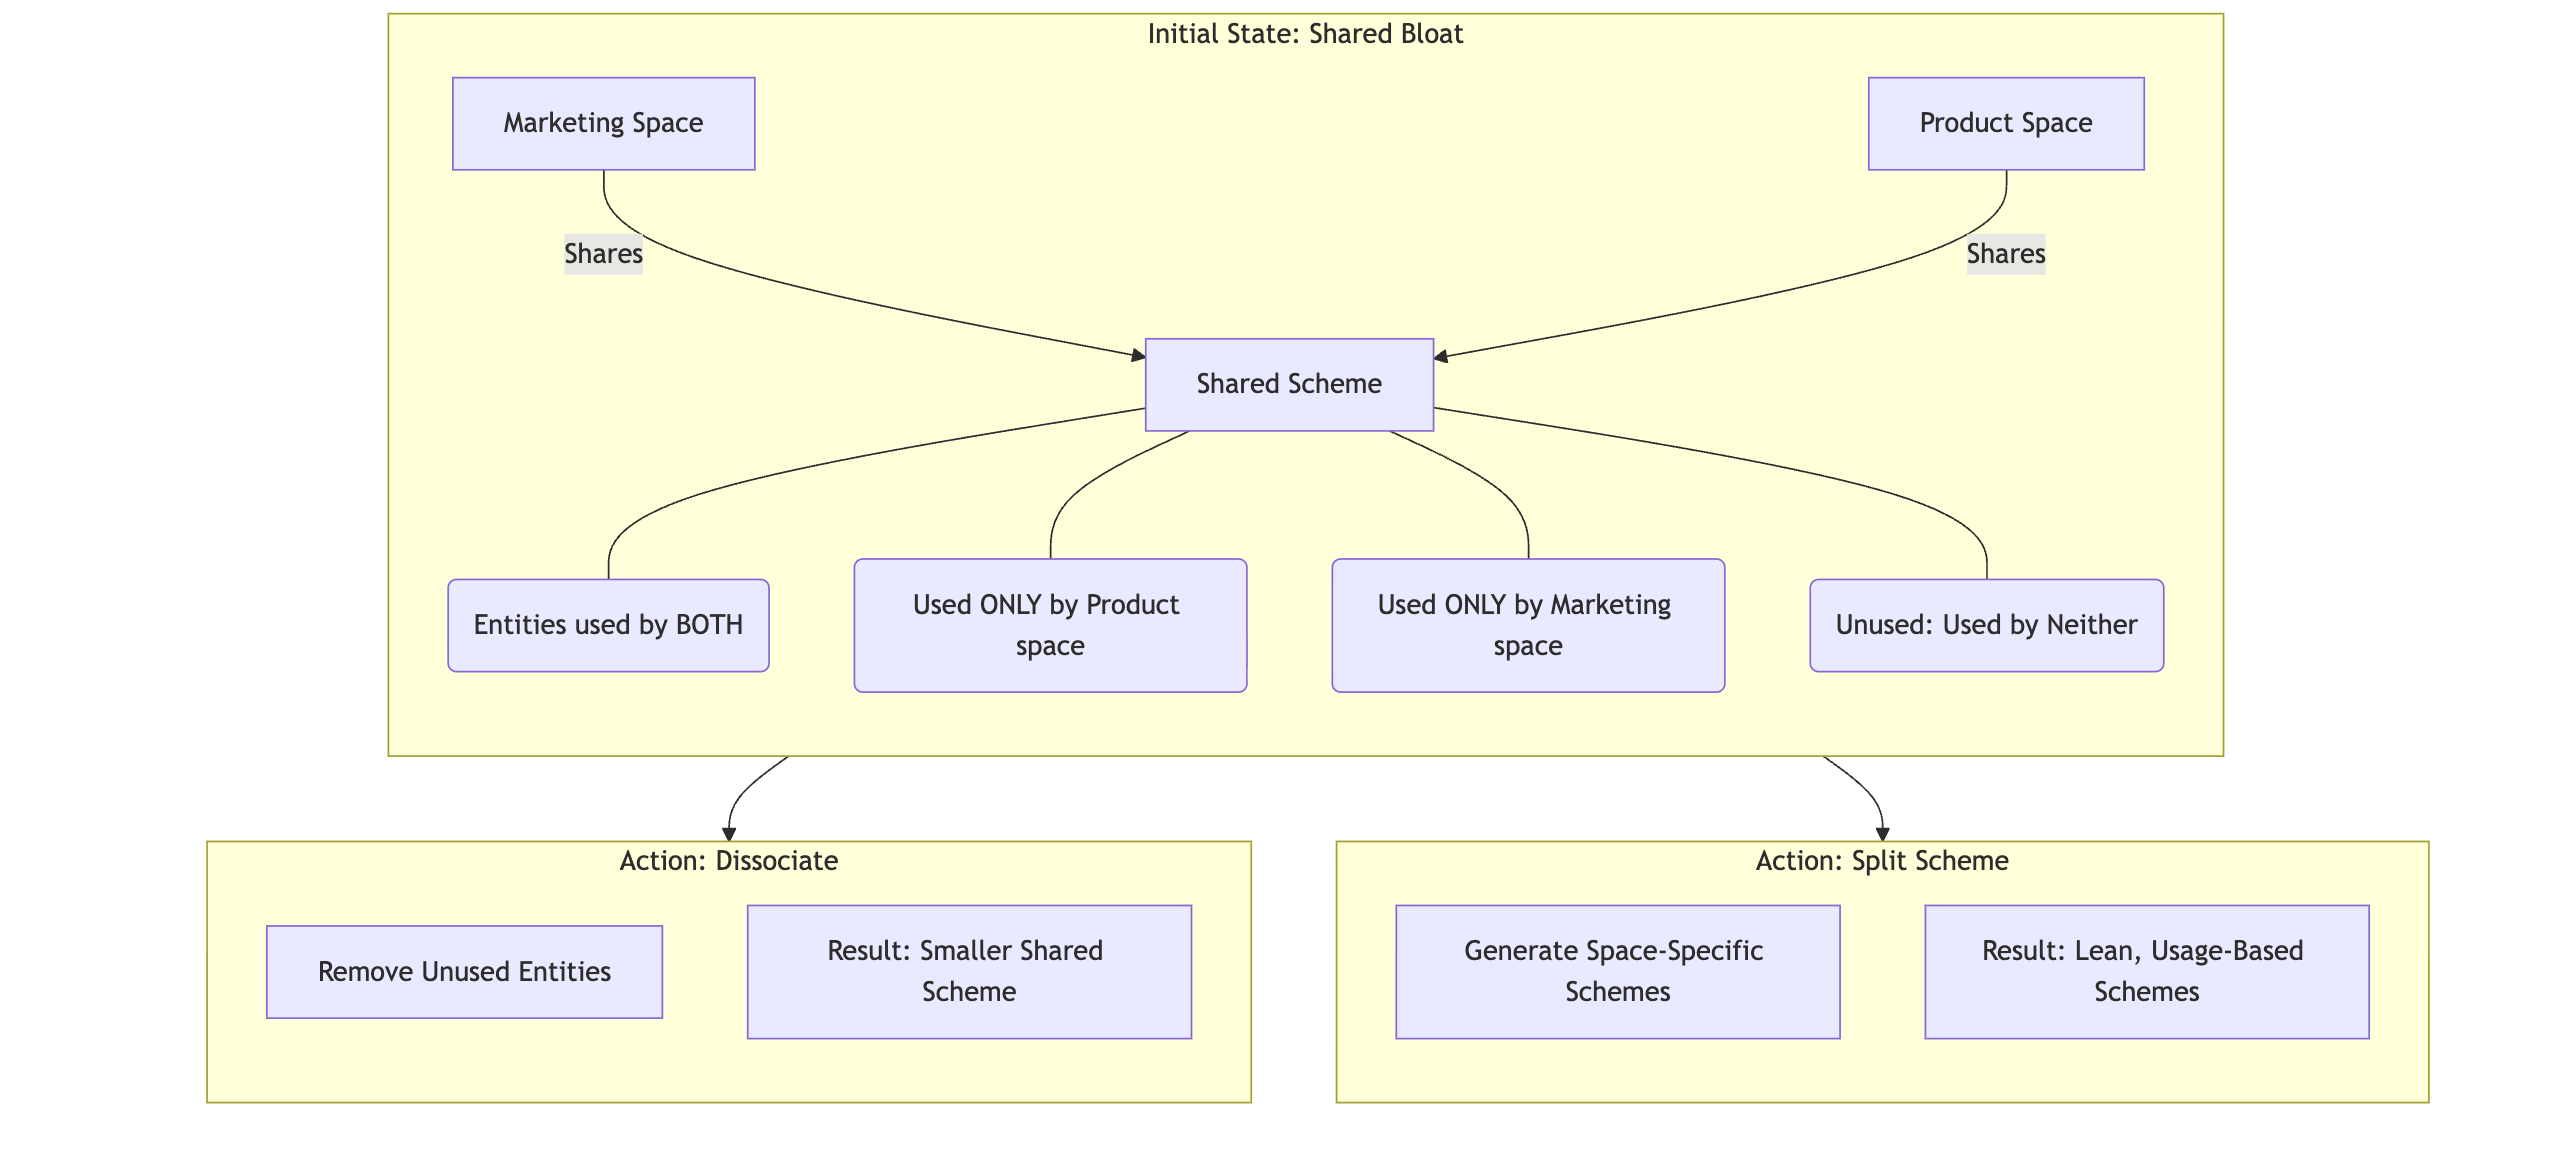
- The admin applies cleanup actions (e.g., dissociate or split schemes), and Jira executes them asynchronously and records full audit logs.
High level architecture
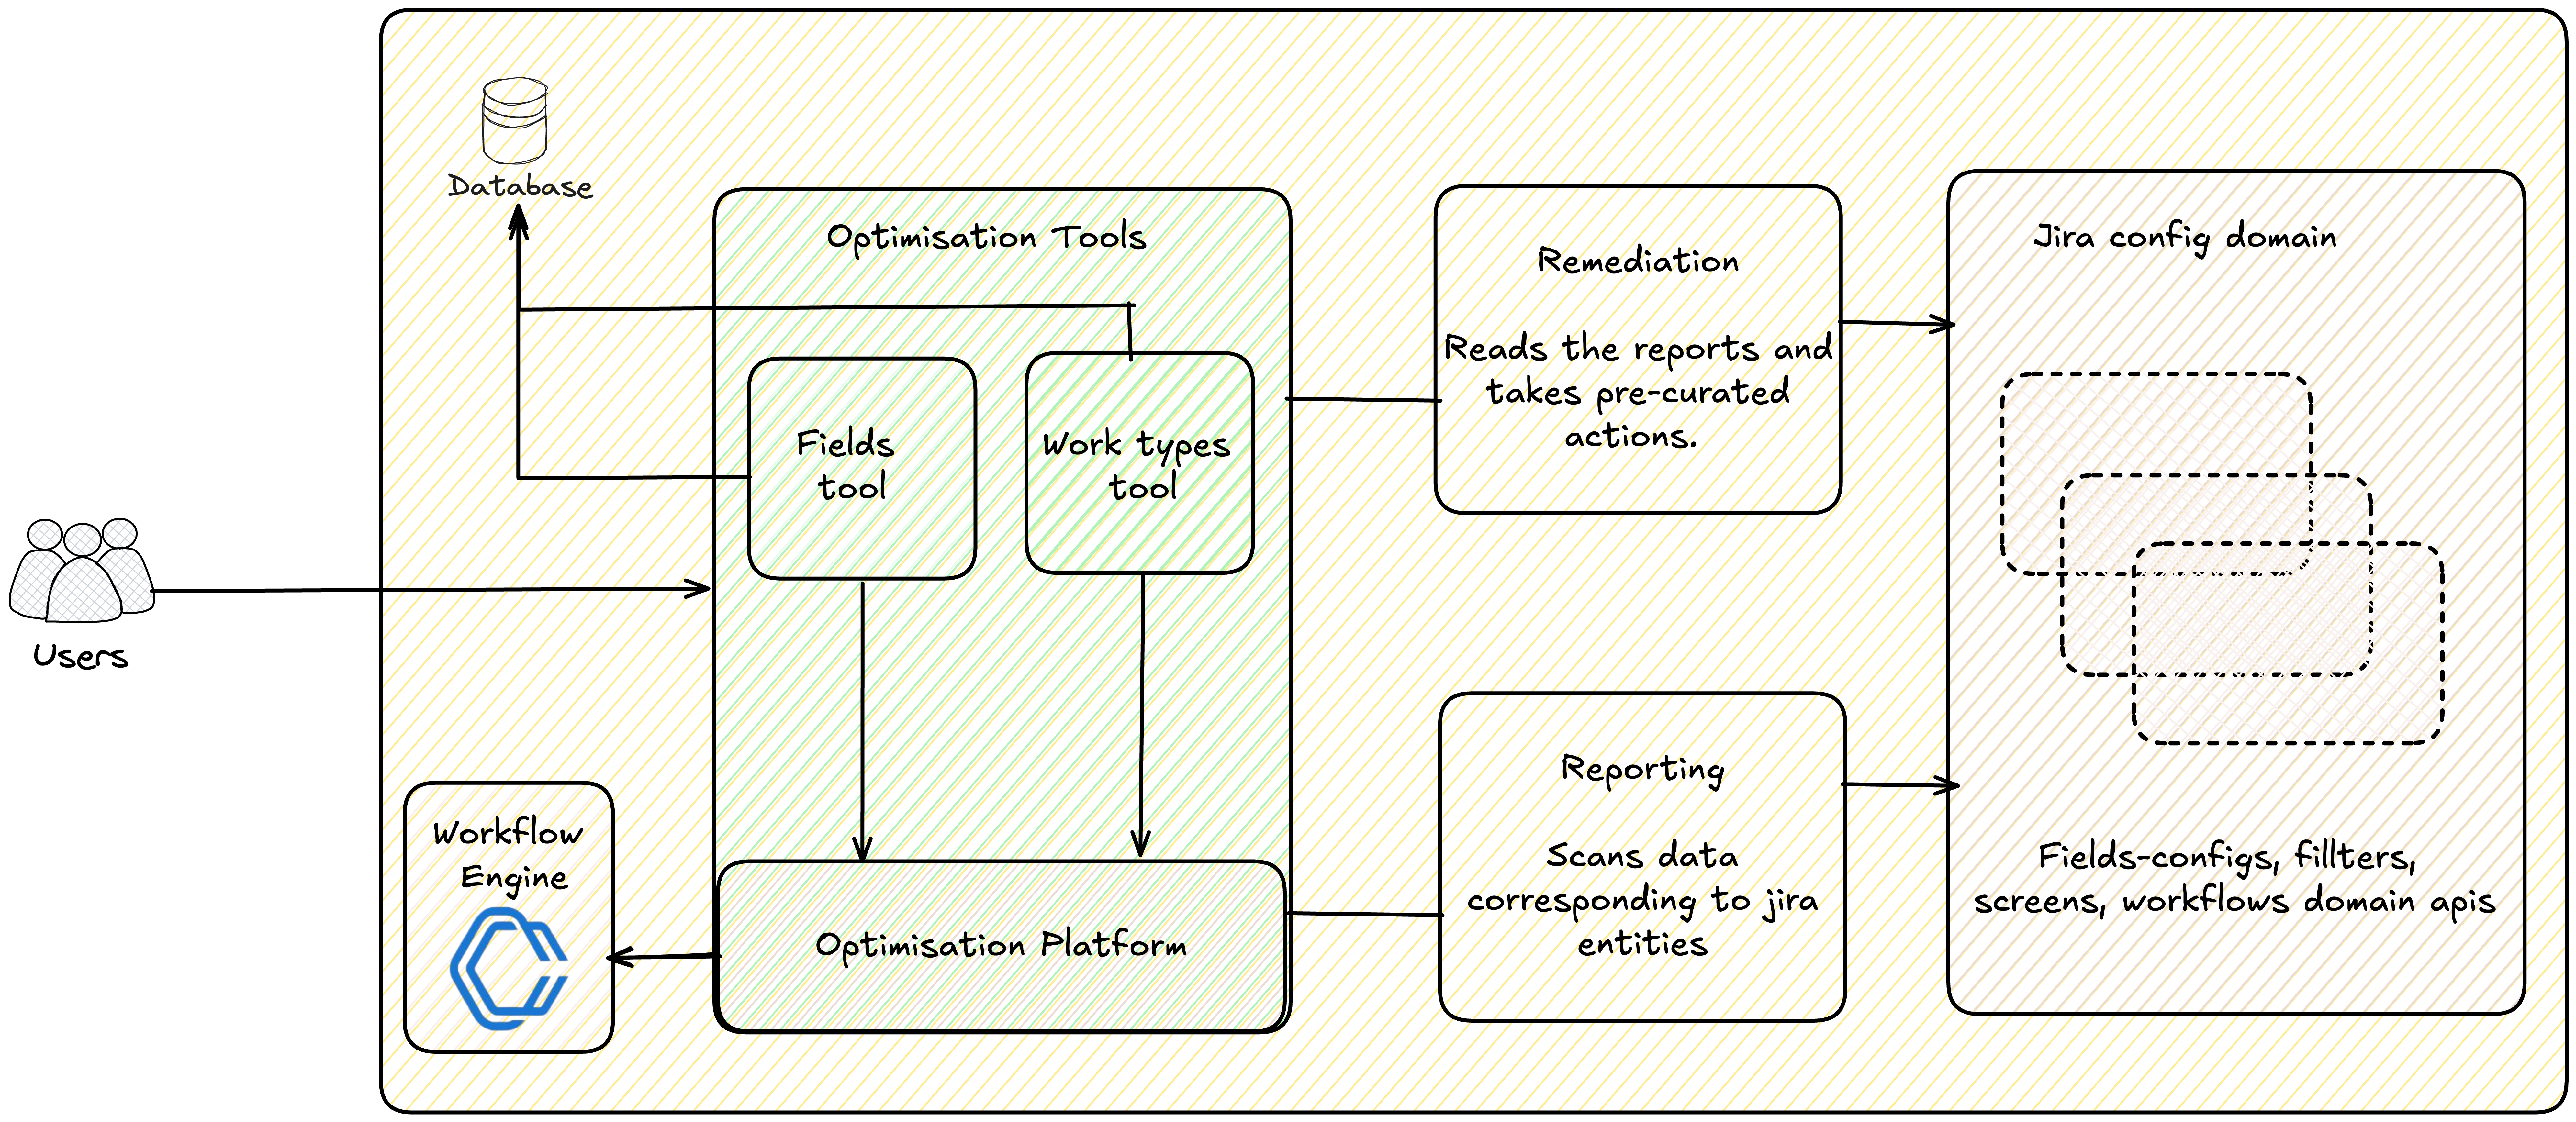
At a high level, optimisation flow is split into optimisation‑tools (the product experiences and domain logic) and the optimisation‑platform (shared services and workflows that make them safe and scalable).
For each supported entity type (today: fields and work types), every tool follows the same two phases:
- Reporting – find opportunities to bring a space’s data shape back under limits and guardrails.
- Remediation – apply safe, auditable changes based on those findings.
On the reporting side, the platform runs asynchronous jobs that scan Jira data for a given scope (for example, a space) using domain APIs. For work items, this can mean fetching keys from work items service; for configuration like fields or work types, we call the relevant services directly. This work runs on top of our pre‑computation framework and workflow orchestration engine, which handle orchestration, batching, retries, and observability. The output is a stored report describing how that space deviates from our limits and recommendations.
On the remediation side, optimisation tools expose opinionated, pre‑curated actions that consume this report and mutate configuration to reduce bloat: dissociating unused fields, splitting field configuration schemes, or cleaning up unused work types.
All changes flow through Jira’s existing safety nets and audit logs, so admins can see exactly what was done and, if needed, manually roll it back.
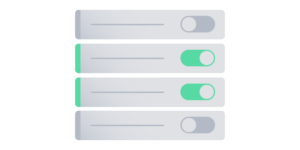
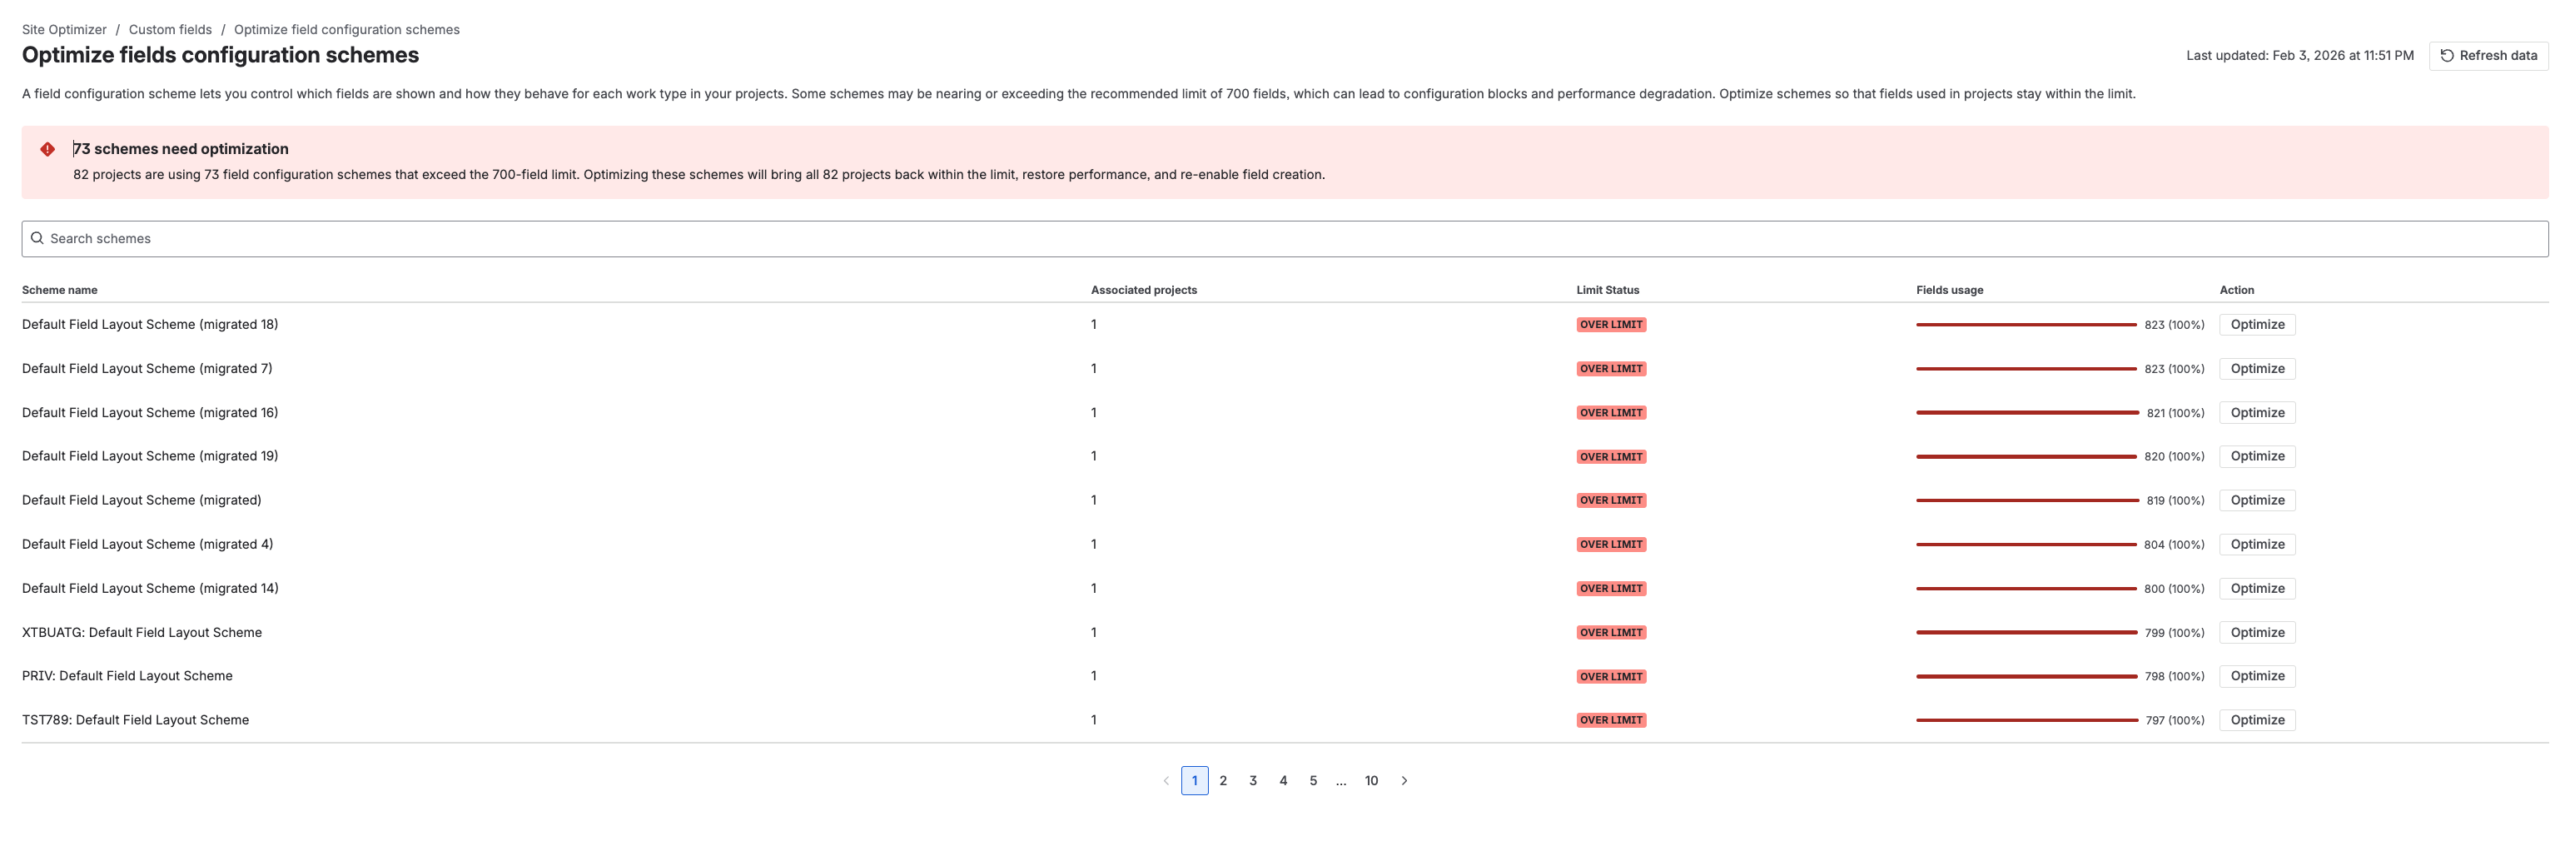
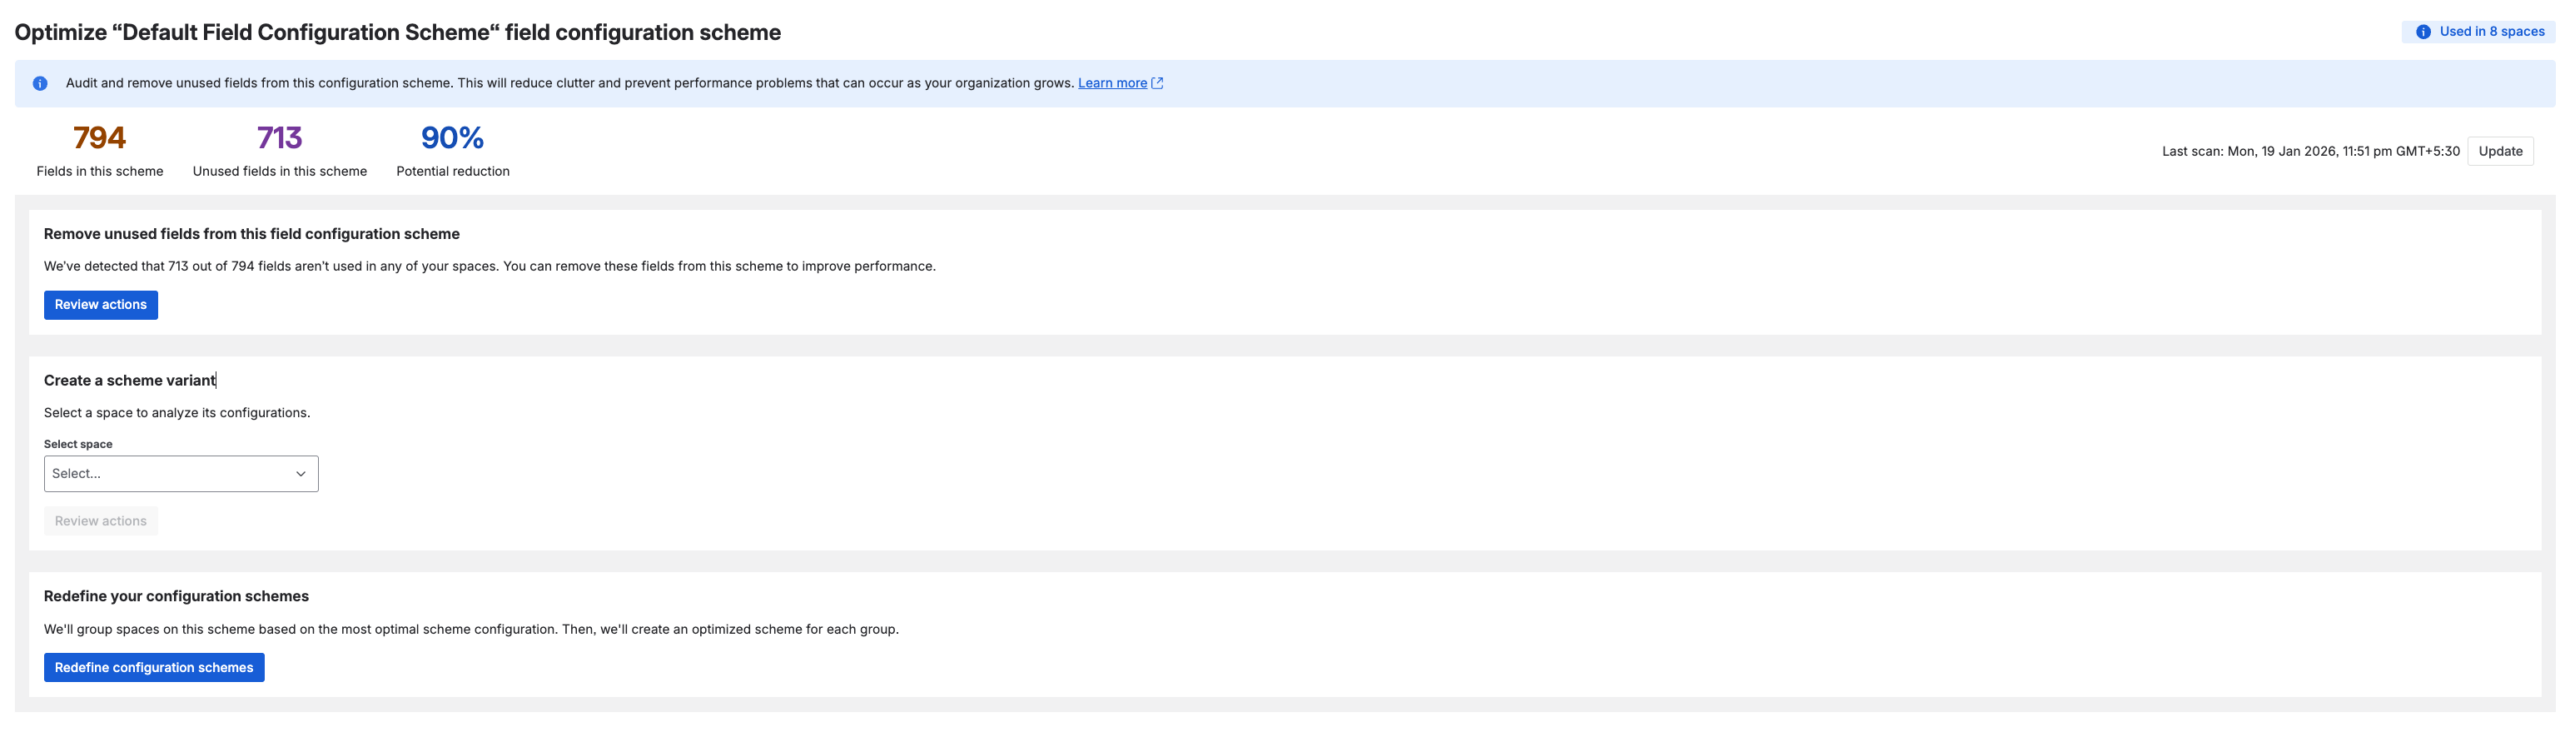
Optimisation tools and site optimiser view in Jira
Here are few snapshots of the optimisation screens to set the context

Pre-computation framework
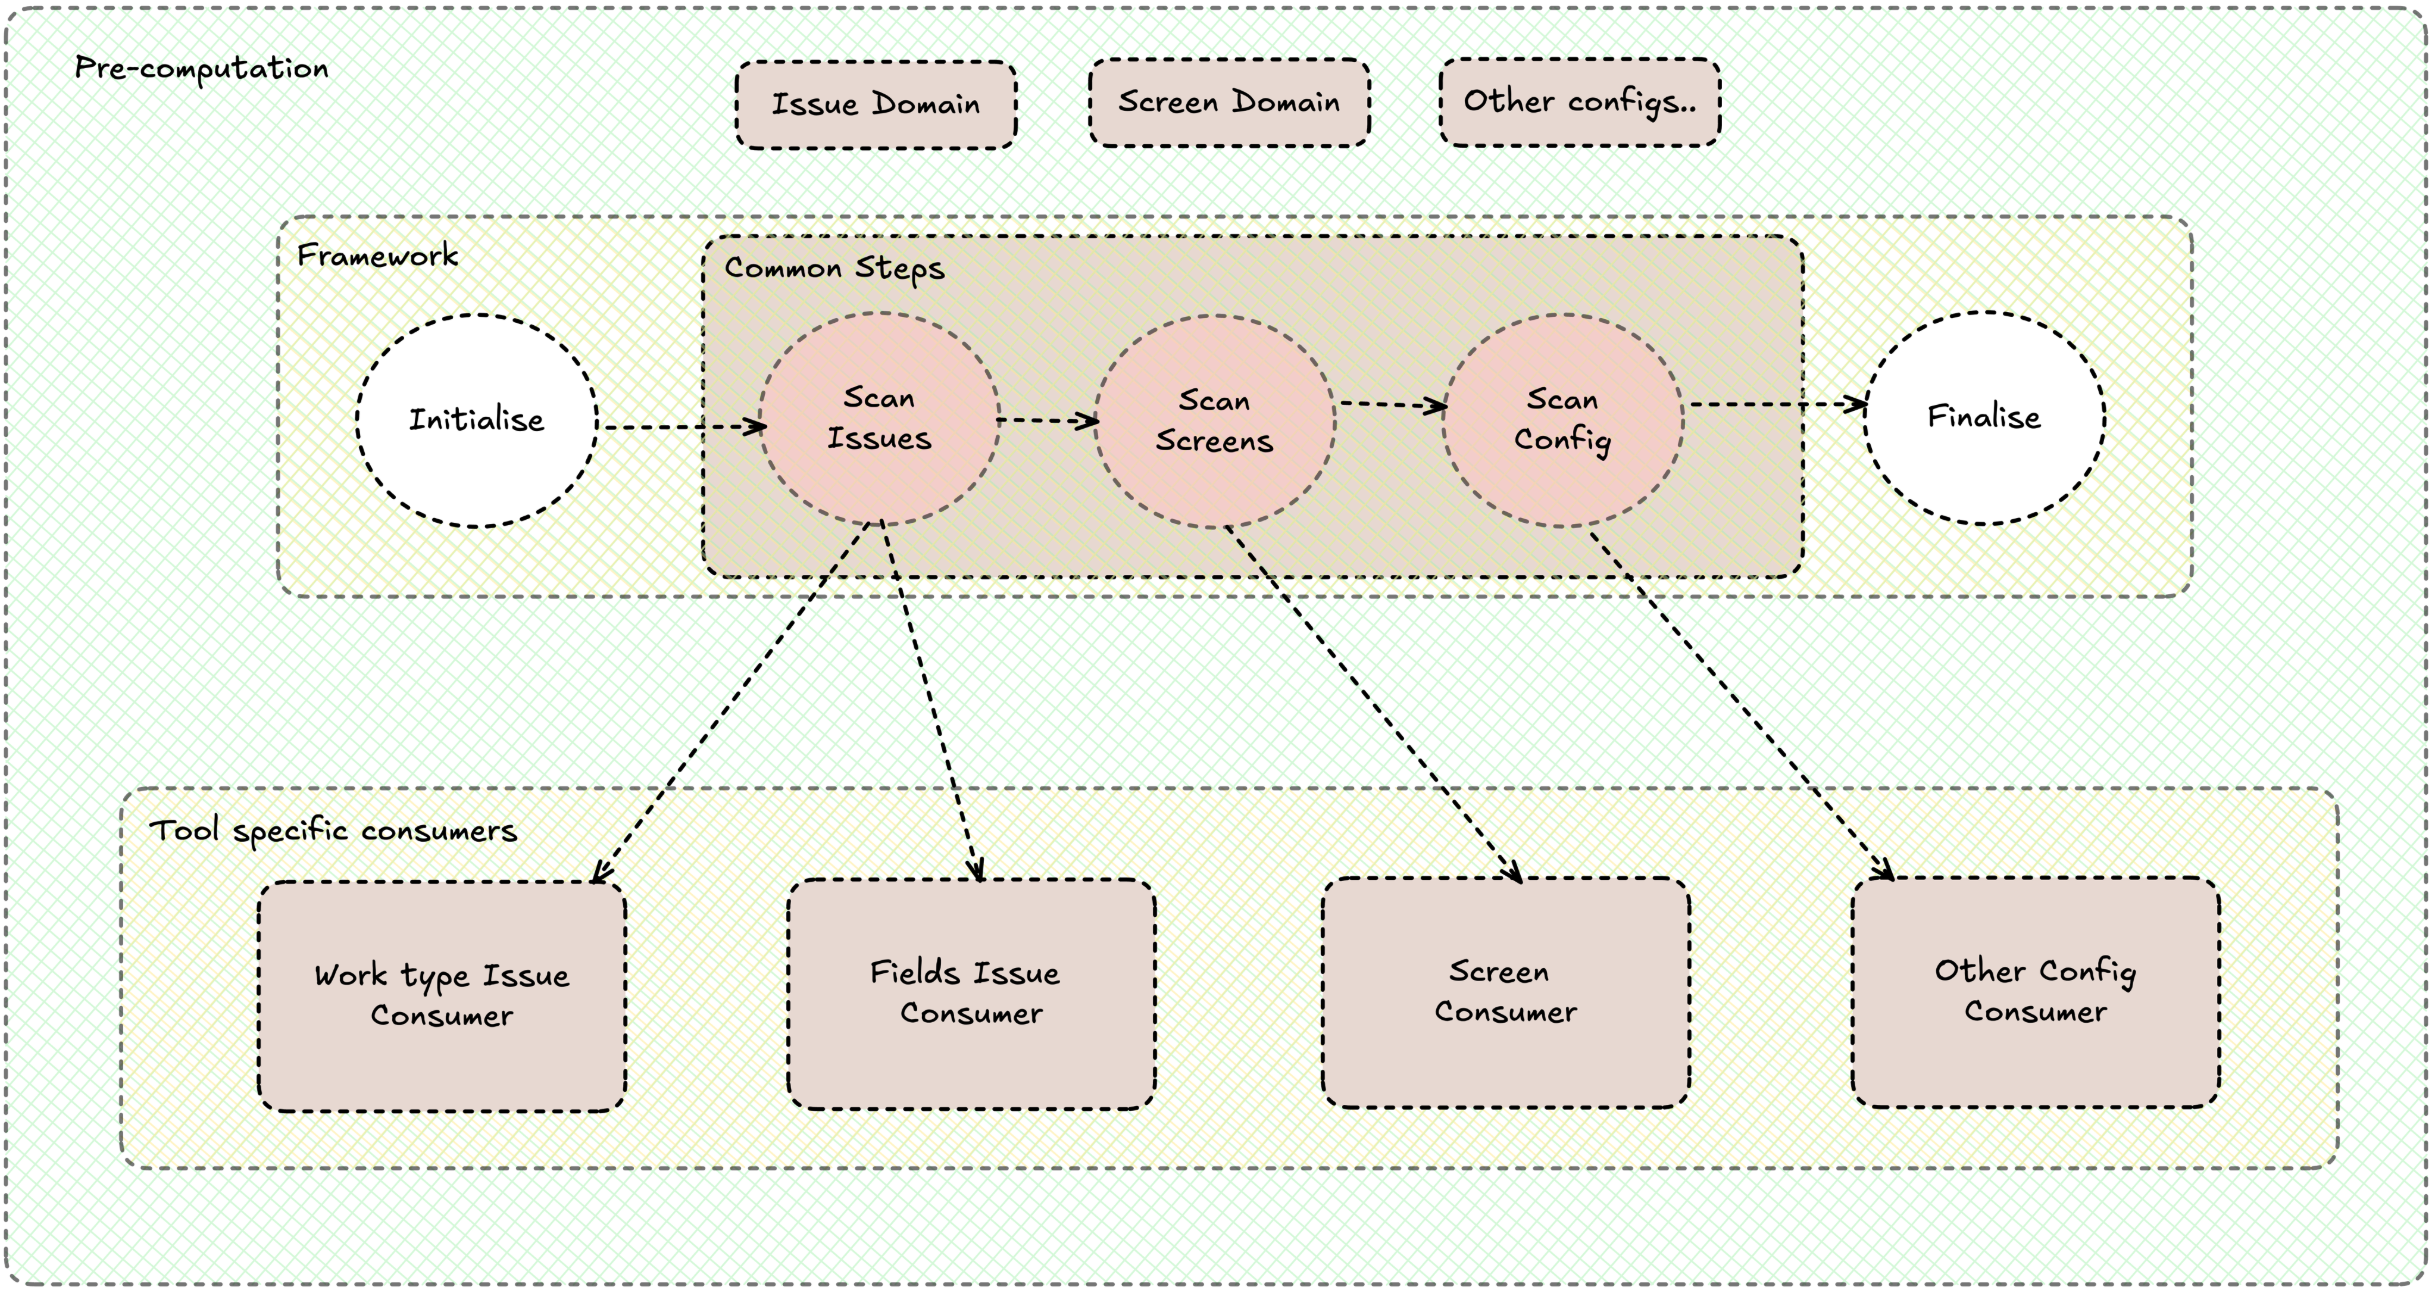
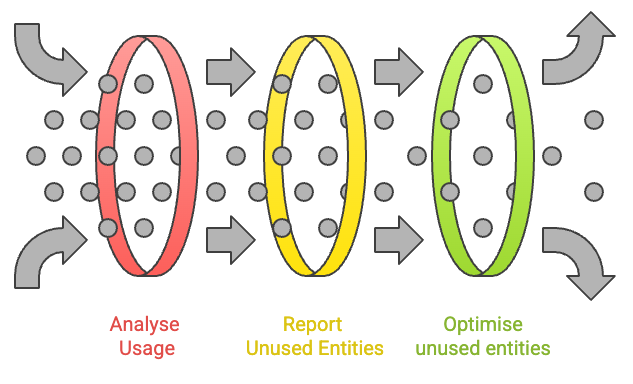
Optimisation tools only deliver value if they work at Jira scale. That means we can’t compute everything on the fly in admin UIs. Instead, we use pre‑computation: we run asynchronous reporting jobs that scan Jira data, produce a report for a given scope (for example, a space), and let optimisation tools and UIs consume that report cheaply later.
The pre-computation framework is the layer that makes this repeatable. It sits on top of our internal workflow orchestration engine, owns the workflow, task workers, batching, retries, and observability, and exposes a simple contract. Optimisation tools don’t need to care about orchestrator details; they only plug in their logic.
Each workflow follows the same pattern, shown in the Pre computation framework design diagram:
- Initialise – prepare for a new job at a given scope (for example, clear or seed intermediate state) while keeping work bounded in time.
- Scan‑steps – the framework streams Jira entities (work items, screens, fields, and so on) in batches. Tool implementations must be thread‑safe, idempotent, and order‑agnostic, so the framework is free to parallelise and retry without coordination.
- Finalise – aggregate everything seen during scanning into a durable report that remediation flows and UIs can rely on.
This separation means the platform can be improved independently (better batching, parallelism, data sources) while individual optimisation tools focus on domain decisions (what “unused” means, which recommendations to surface). The result is a consistent, scalable way to pre‑compute “what’s unused” in a Jira scope, and then fix it with confidence.
Challenges & Solutions
Keeping data updated
Optimisation tools rely on pre‑computed reports about each space (for example, which fields or work types are unused). These reports can become stale as spaces evolve, but recomputing them for every space, on a fixed schedule, is extremely expensive at Jira scale. Refreshing every space regularly would generate an enormous volume of jobs which will result in huge load and stress on Jira APIs, Orchestrator, and the database, without clear customer benefit.
We deliberately optimise for smart, prioritised refreshes by recomputing reports only for spaces nearing limits (≈70% utilisation). Some low-utilisation spaces may see older data, but this lets us focus resources on spaces most likely to benefit from optimisation, keeping the system responsive where it matters most. To reduce the risk of acting on stale data:
- We show the last pre computation time for usage report.
- Admins can run ad‑hoc reporting jobs for specific spaces/schemes whenever they want fresh data.
Storing intermittent and pre-computed usage data
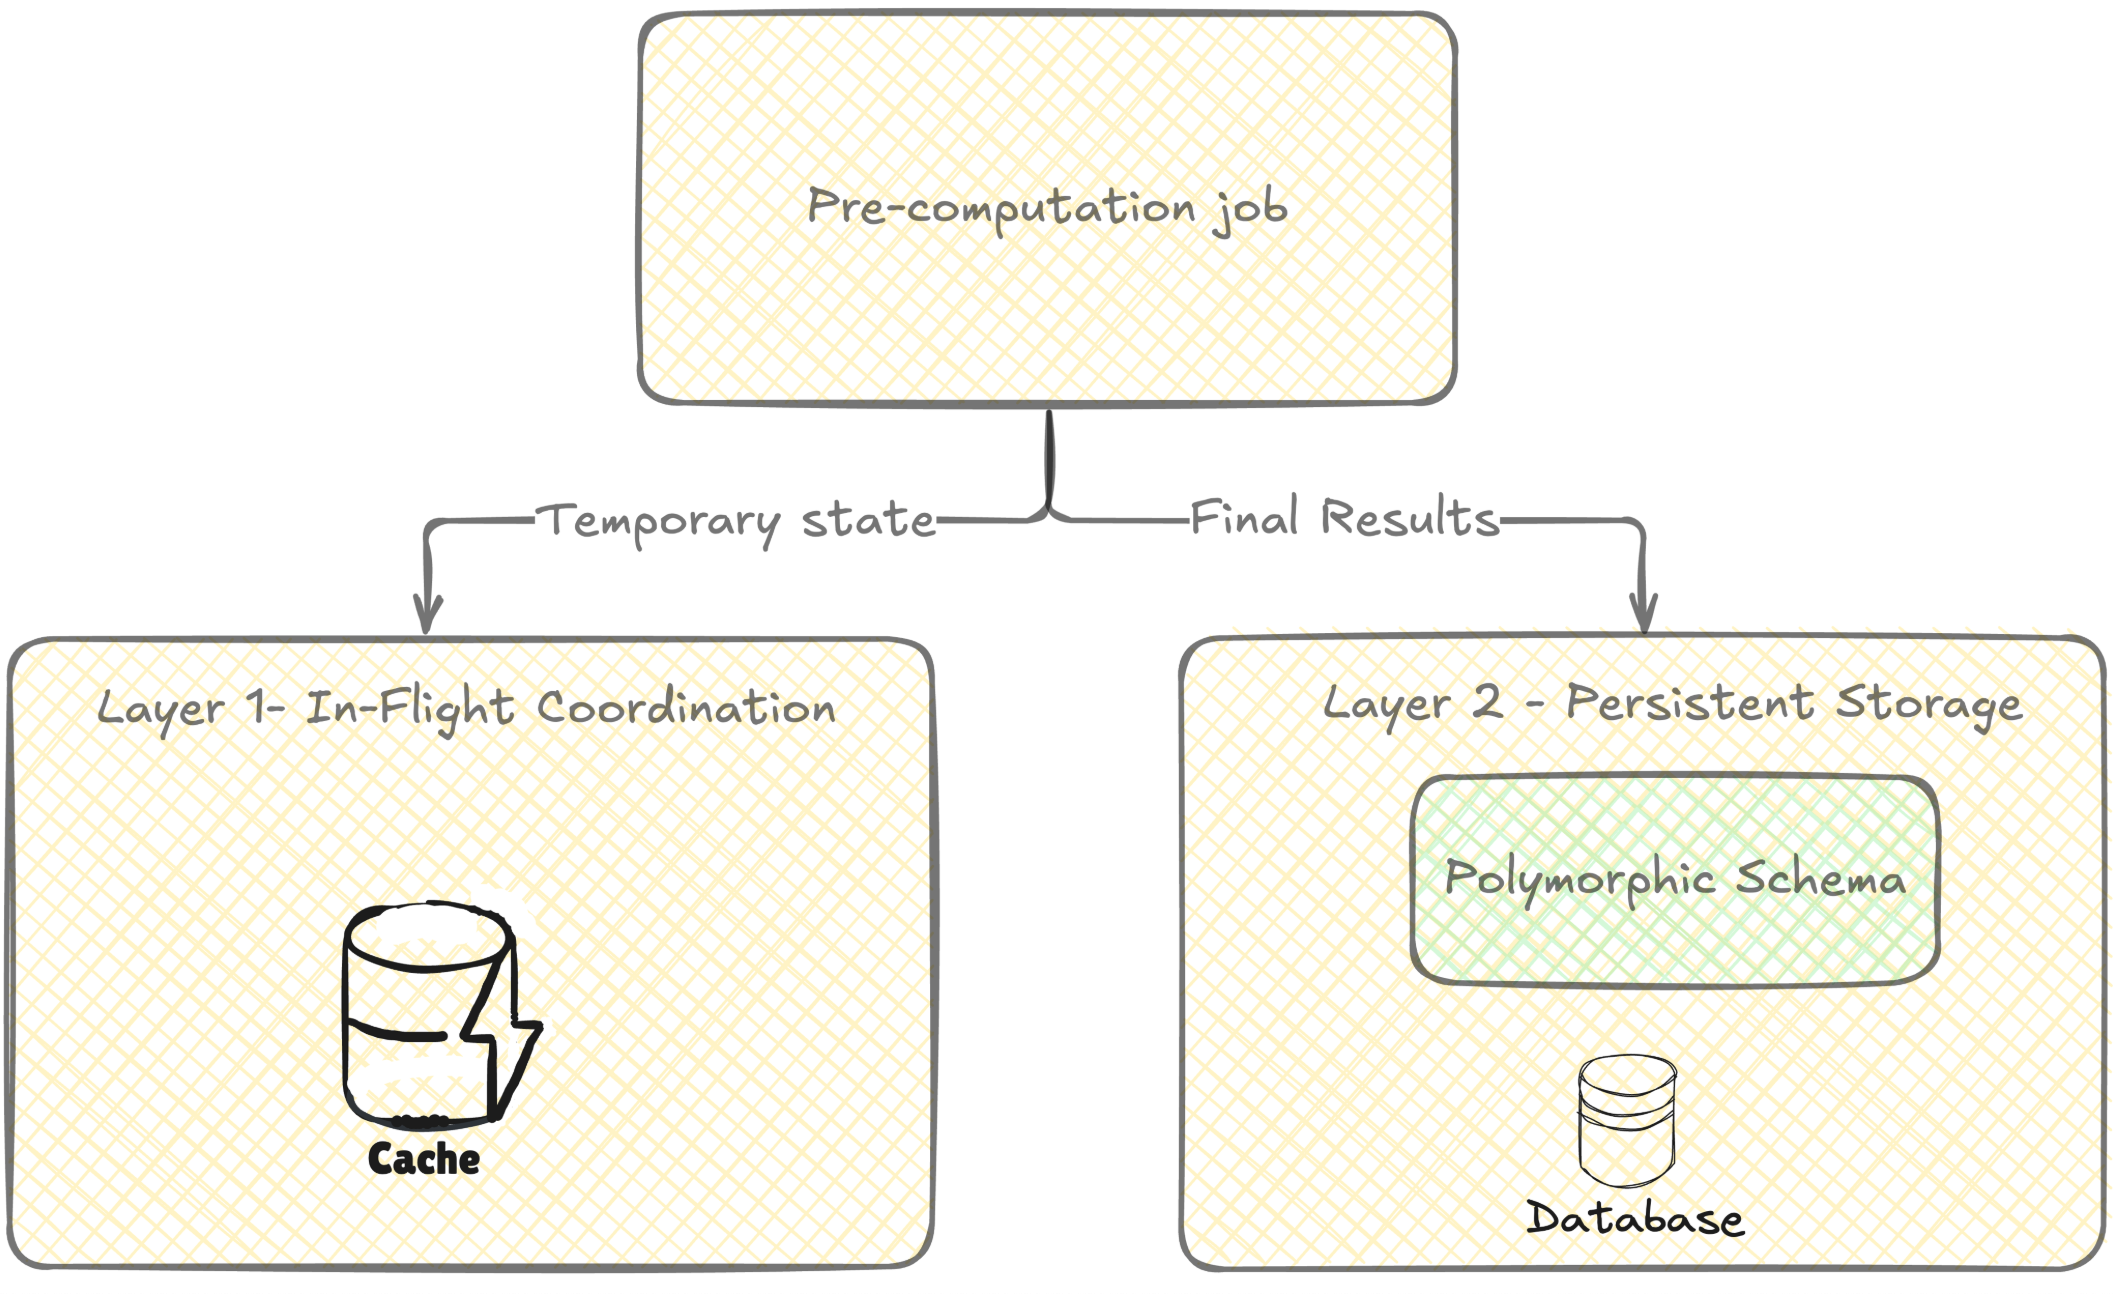
Optimisation tools need to store pre‑computed “usage” data for many Jira entity types (fields, options, roles, schemes, etc.) at scale. This data is:
- Large (up to ~1M records per entity type, per tenant),
- Read‑heavy (queried often in reports and UIs),
- Refreshed in batch (monthly/periodically, not in real time).
Naively adding one dedicated table per entity doesn’t scale in Jira’s multi-tenant architecture: a single new table becomes millions of tables across production, plus indexes and internal database objects. So we used two layers:
- For short‑lived, multi‑step sharing inside a job are memcached.
- For persistent pre‑computation, we store data in the Jira relational database using a small set of generic tables (polymorphic “usage” tables) instead of one table per entity type,
This design balances:
- Scale and cost – fewer database tables across tenants, reducing metadata RAM and operational overhead. Adding a single table creates millions of database objects(tables, indexes) as per to Jira’s multi-tenant architecture.
- Performance – still allows efficient, indexed queries over usage data.
Recoverability
Optimisation tools can make large, structural changes to Jira configuration (like removing unused fields or simplifying schemes). That’s powerful, but it also means mistakes or unexpected side effects must be recoverable. Right now we focus on safety and transparency:
- Actions are targeted and opinionated, based on pre‑computed reports.
- All changes are logged in audit logs, so admins can see exactly what changed and manually reverse or adjust configuration if needed.
- We already have assisted rollback and over time, we plan to add guided, in‑product rollback on top of this foundation.
Impact

Since launching optimisation tools, we’ve seen clear, large‑scale impact on Jira configuration health.
Admins across organisations have removed tens of millions of unused fields and work types using these optimisation tools. Some customers have streamlined hundreds of thousands of fields and work types in a single day — a process that previously took weeks of manual effort. This volume represents significant configuration growth being safely streamlined:
- Lean(er) configuration: Optimisation tools enable vast majority of tenants to stay within the limits, including our largest enterprise customers. This simplifies configurations and makes them safer to evolve.
- Improved performance characteristics: While performance gains will vary by site, reducing the volume of fields and work types directly helps with index size, search complexity, and the cost of configuration‑heavy operations.
- Better admin experience: Instead of hunting through obscure screens and schemes, admins get opinionated, pre‑computed reports that tell them what’s safe to remove and why. Clean‑up that previously took days of manual analysis can now be done in focused sessions.
- Stronger foundations for future guardrails: With the worst cruft removed, it’s much easier to introduce sensible limits, guardrails, and automation without breaking long‑tail edge cases in messy, legacy configurations.
To summarise, optimisation tools are not just a one‑off clean‑up button – they’re actively helping admins reverse configuration bloat at scale and setting Jira up to stay healthier over the long term.