This is a guest post written by Tiffany Cantle, Senior Marketing Manager at BigPanda.
 We all need to move fast in order to stay competitive. But the faster things move, the faster things break.
While many companies have made great strides towards automating application release and infrastructure management, automation for service assurance has been sorely lacking. That’s left Dev and Ops with a problem: how to effectively service alerts that have grown by orders of magnitude.
A manual approach to a machine-generated problem?
Let’s use an example to illustrate. Consider a MySQL cluster with 35 hosts. Some of these hosts have been experiencing high page-fault rates, and a few others have complained of low free memory. By conducting checks on these specific hosts, the issues would be detected by your system monitoring tool, which would then send a variety of alerts to the Network Operations Center (NOC) or responding service team.
Once the alerts have been created, the natural next step towards remediation is to create a Jira Service Desk ticket. But how exactly?
There are two primary ways that most companies do this – and both are problematic.
The first way is for a NOC or IT engineer to spot the problem and manually create a ticket. This involves:
- Manually filtering through all active alerts to determine which ones are symptomatic of the same issue
- Conducting an initial investigation to define the severity of the issue and determine whether or not it can be remediated by the service desk or requires escalation
- Manually creating a ticket and populating it with relevant alert information
And just like that, the chain of automation hits a manual roadblock. Imagine doing this for hundreds (or thousands) of tickets everyday!
The alert correlation remedy
The alternative to manually creating tickets is to have your monitoring tools automatically trigger a service desk ticket. However, given that most of today’s monitoring tools are very, very noisy, automatically triggering tickets based on alerts simply extends a noisy alert problem into a noisy ticketing problem.
Automatically triggering tickets based on alerts simply turns a noisy alert problem into a noisy ticketing problem.
The key to enabling automation is to tackle the very thing that creates the roadblock in the first place: alert noise. Nobody wants to send thousands of raw alerts to a ticketing platform. But if ops teams were able to tamp down the fire hose so that only meaningful incidents emerged from the operational data flood, it would be a different story.
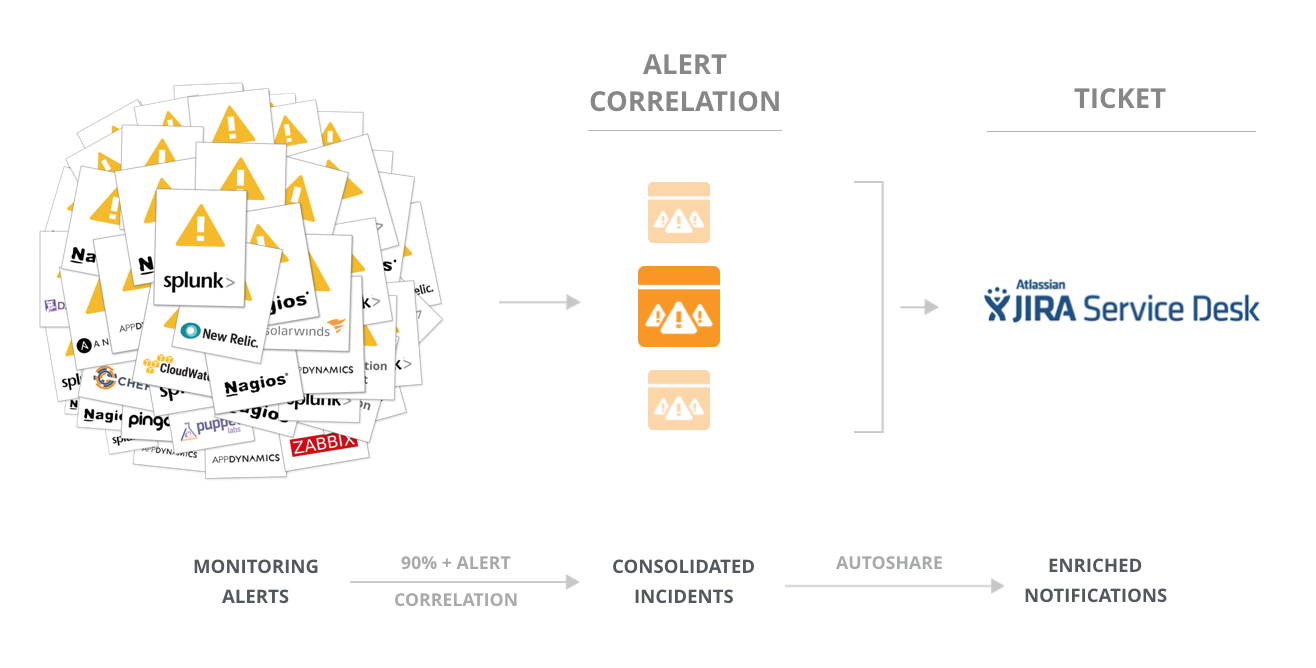
Enter: alert correlation. The goal of alert correlation is to automatically identify highly-related alerts and group them into a single, consolidated incident. It works by grouping alerts along three main parameters:
- Topology – the host, hostgroup, service, application, cloud, etc. that emits the alerts
- Time – the rate at which an alert cluster forms
- Context – the check types of the alerts
If alert correlation were applied in the example above, the Ops team would have been presented with a single incident that groups together all of the memory and page-fault alerts for that particular MySQL cluster. They could easily distinguish between the alerts belonging to that incident and other similar alerts. They’d know right away whether to loop in Dev, or let them continue coding away.
Breaking down the wall to true automation
The modern IT stack consists of about 6-8 tools, which makes developing alert correlation rules by hand rather expensive. Plus, whenever a change occurs – be it a server reconfiguration or the renaming or deployment of an app – it immediately invalidates the correlation rules the team worked so hard to establish.
Fortunately, Jira Service Desk teams can take advantage of an alert correlation tool like BigPanda to automate this process. Alert correlation achieves upwards of 95% compression between raw alerts and consolidated incidents. And auto-sharing features in tools like BigPanda allow Ops to entirely automate the process between IT monitoring, alert correlation, and ticketing.
Correlation tools take alerts from all of an organization’s various monitoring tools and automatically applies a powerful correlation algorithm to consolidate alerts into single, unified incidents. Once an incident is created, Ops teams have the ability to implement a sharing rule to automatically create a Jira Service Desk ticket.

So rather than having to deal with a flood of tickets, Ops only receives one ticket, which is:
- Created automatically based on consolidated incidents
- Updated in real-time as monitoring events continue to evolve
- Automatically enriched with relevant information such as metrics, CIs, and runbook links
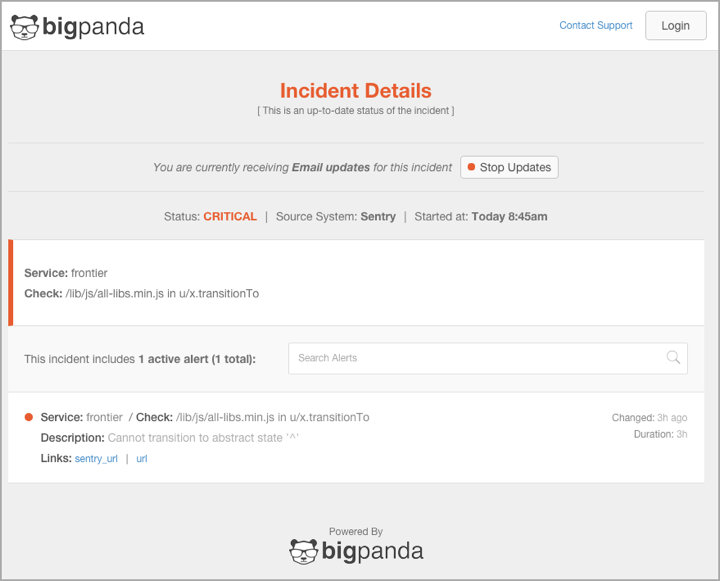
Sending consolidated, helpful tickets that are enriched with operational data, instead of drowning in noise, empowers developers to take immediate action on an incident without having to dig. Tickets include all historical and real-time monitoring information, and can also be linked to change management tools so that developers can easily trace issues back to recent code deployments.

Marrying the capabilities of Jira Service Desk with alert correlation not only automates IT monitoring and service assurance, but also fosters a healthy collaboration between Dev and Ops. It’s a win-win-win situation: for Ops, for Dev, and (most importantly) for your customers.
Want more DevOps? Check out our DevOps tools page for more DevOps workflow ideas.
About the author
Tiffany Cantle is a Senior Marketing Manager at BigPanda. She is passionate about helping DevOps and IT Ops teams reduce noise and improve performance through intelligent alert correlation. In the non-working hours, she loves running, traveling, and hunting down a good cup of coffee. Learn more about how BigPanda can enrich Jira Service Desk by keeping your ticketing in sync with your monitoring stack or request a free demo.
