This post was written by Michael Knighten, Founder & COO of Sleuth
What it takes to deploy continuously
There are some similarities between deploying continuously and driving in the fast lane.
When driving, you need to be always on the alert, proactively looking down the road for potential hazards. When you see them, you need to be able to react immediately, hit the brakes, and change course nimbly.
When deploying continuously, teams also need to be alert, and get good at coordinating and tracking deployments to avoid or resolve production issues.
The activities may include: deploying to pre-production environments, blocking a deployment when another is in progress and may conflict, and – as with driving in the fast lane – monitoring for issues that may require remediation after each deployment.
The typical deployment orchestration work is a layer of manual interventions on top of your Bitbucket workflow and pipeline, perfectly ripe for tooling and some automation.
In this post, we’ll outline the deployment process and tools that Statuspage, Atlassian’s incident management solution, uses to orchestrate deployments to ship to production 6-8 times a day.
Statuspage’s deployment process
Atlassian’s Statuspage engineering team uses a number of tools as part of its deployment process, including Bitbucket, Jira, and Confluence for source control, issue tracking, and CI, as well as observability tools like Sentry, SignalFx for errors and performance monitoring. Also included is Pollinator, an internal monitoring tool that tracks to see whether or not a particular page is reachable and runs tests, and Sleuth for deployment mission control. The toolchain is extensive and constantly evolving, but they serve a common purpose: making deployments fast, easy, and safe for the developers.
Statuspage’s deployment process looks like this:
- Developers create a branch and push code changes to Bitbucket, which triggers Bamboo to run a build. When they get a green build, they open a pull request.
- When the pull request has been reviewed and approved, the developers merge it to the main codebase.
- Bamboo kicks off a deployment to staging and production environments. A new auto-scaling group fronted by load balancers gets created for each of the services that make up Statuspage.
- A homegrown Atlassian PaaS runs a Docker image that executes a number of semantic checks. When the checks pass, traffic from existing auto-scaling groups gets routed to the newly created ones.
At Statuspage, all this occurs between 9 a.m. and 3:30 p.m. They are under strict “do not merge” orders at all other times.
“This helps developers stay sane,” said Caspar Krieger, Statuspage architect.
“Everyone has this tendency to wish that whatever change they’re making is going to be just fine. But sometimes… they’re wrong. And they deploy it at, like, 6 at night. And then someone who happens to be on call then gets woken up because of a deployment issue.”
“People get woken up enough from actual, legitimate alerts,” he said. “Let’s not make change-related alerts be another reason to awaken.”
Many teams have invested time, money, and energy in their toolchains. While each tool has a role to play, the one tool teams like Statuspage increasingly use for coordinating and tracking the health and progress of deployments is Sleuth.
Coordinating deployments using Sleuth
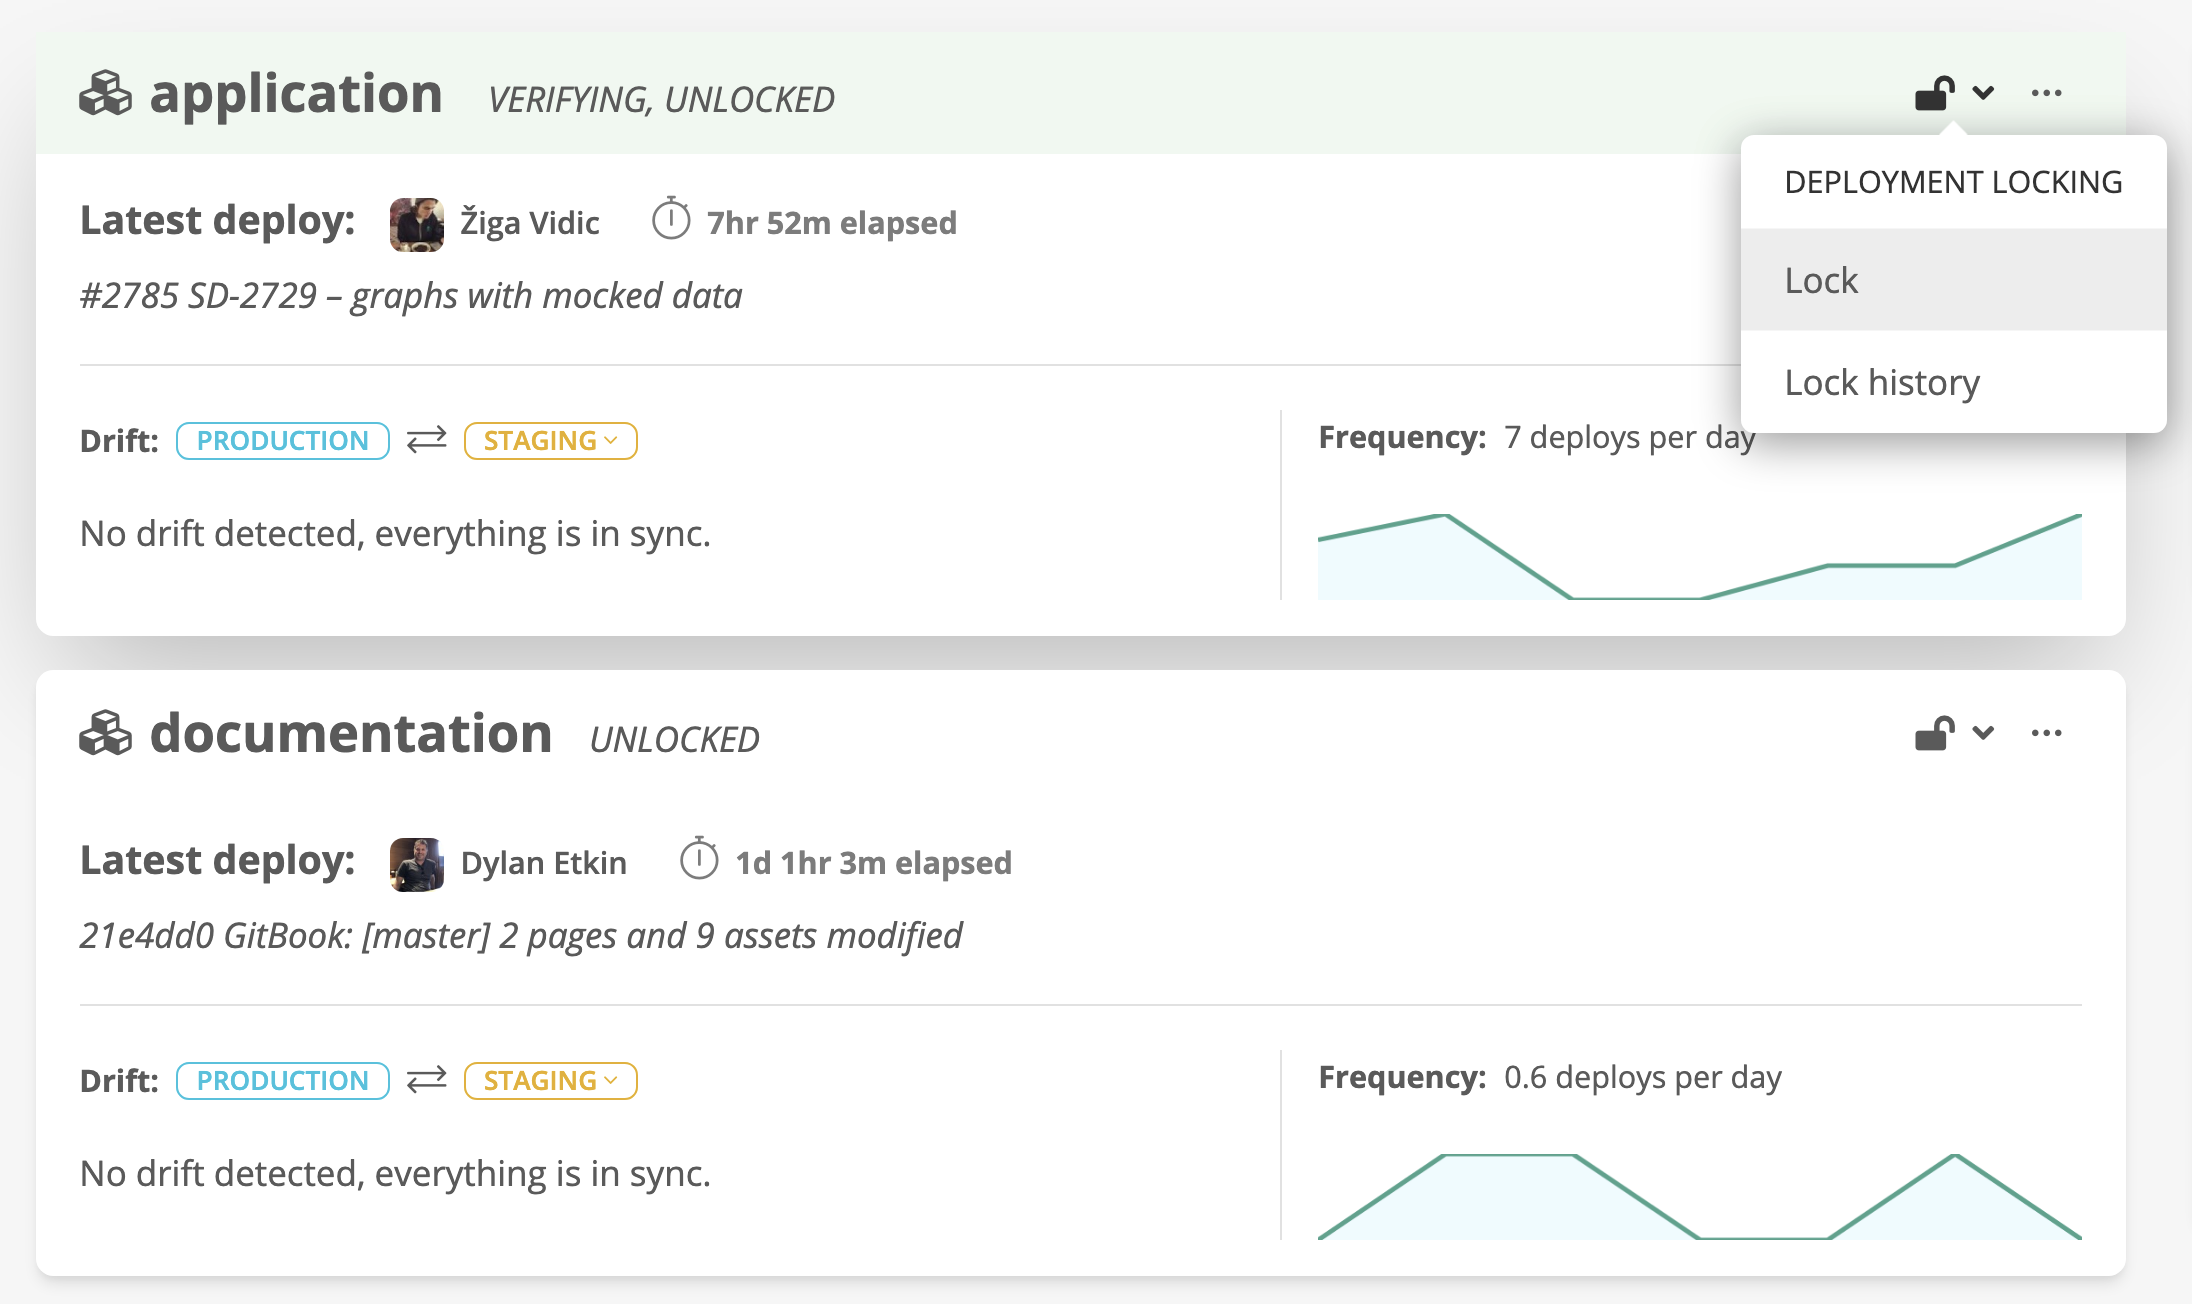
To enforce the deployment schedule, Statuspage uses Sleuth’s “locking” feature, which blocks sending changes into production outside of the designated timeframe or at any time the team wants to put a pause on deployment. Using this feature has proven to be a game-changer.

Before using Sleuth, Caspar said, Statuspage relied on Slack to send the message that deployments were closed. But not everyone would always get the message.
Sometimes, an unsuspecting developer would click the “merge” button on their pull request and send their change into production anyway. That usually leads to a scramble.
“Using Sleuth has been really nice to stop that from happening,” Caspar said.
Although Sleuth has an automatic locking option, Statuspage teams prefer to lock deployments manually, entering the reason why – “a nice feature,” he said. During lockdown, no one can even click the “merge” button on Bitbucket pull requests.
Seeing what’s shipped and its impact
Statuspage uses a number of tools like Sentry and SignalFX to help the team know immediately if something goes wrong after a deployment. It makes sense – after all, shipping eight times a day means mistakes can potentially find their way into Statuspage’s customers up to eight times a day.
Sleuth helps organize the data those tools collect from a deployment point of view. This is important because whenever these tools detect issues, the issues can often be traced to particular deployments.
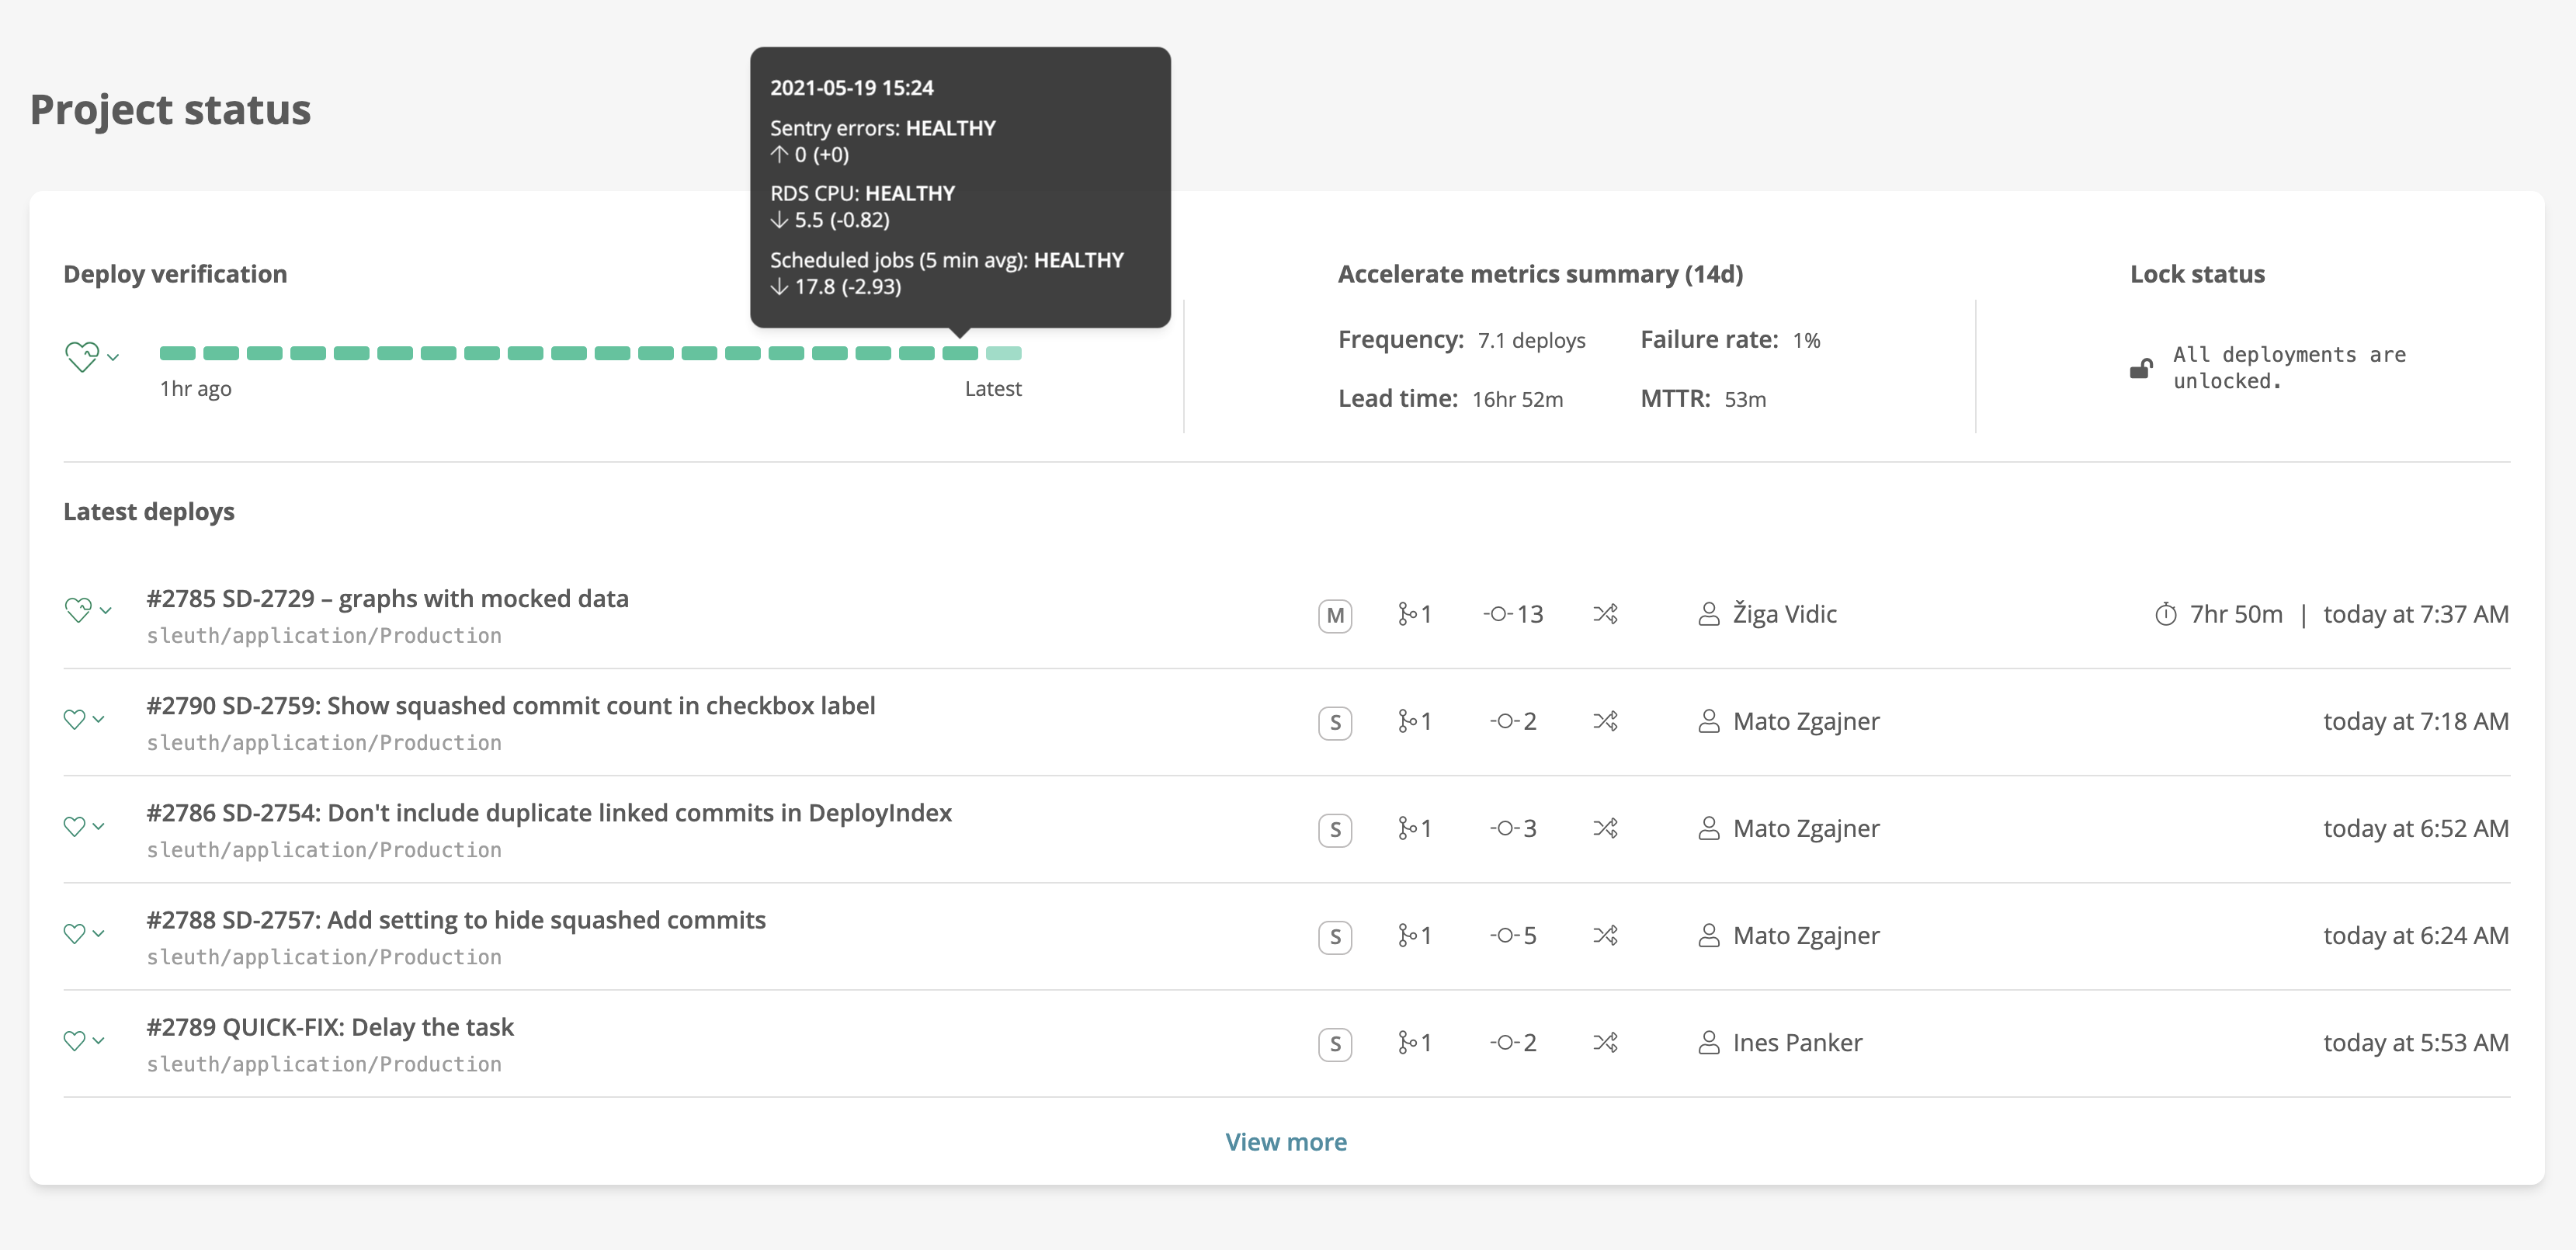
By aggregating errors and metrics data from Sentry, SignalFx, and their internal tools into a single screen, Sleuth gives Statuspage developers an easy way to track the impact of each deployment.

It allows a developer to see, for example, that the code they’ve just deployed has resulted in increases in error rates and memory usage but not to the point where it requires remediation when compared to established baselines. In other words, that the deployment is “healthy”.
Conversely, because developers now know immediately when a deployment is unhealthy, they can ensure they don’t make the problem worse.
“When the sh*t hits the fan,” Caspar said, “you want to have a way to stop people from making the sh*t worse.”
It’s not done until it’s shipped and healthy
Statuspage’s team deploy continuously, which means their developers are responsible for their own deployments.
They want to use tools that give them clarity and control over deployments. Along with Bitbucket and Bamboo, Sleuth is the perfect tool for the job.
If you’re interested to learn more about Sleuth, you can try it for yourself. It comes with a 30-day free trial. You can also read their docs or contact their team.