The Jira Service Desk Server Team is committed to making it easier and faster for your teams to get stuff done. With the release of Jira Service Desk Server 3.9, we’ve made canned responses even more powerful, we’ve improved the automation around approvals, and we’ve introduced live monitoring with JMX. Read on to find out more.
Canned responses with a little more oomph
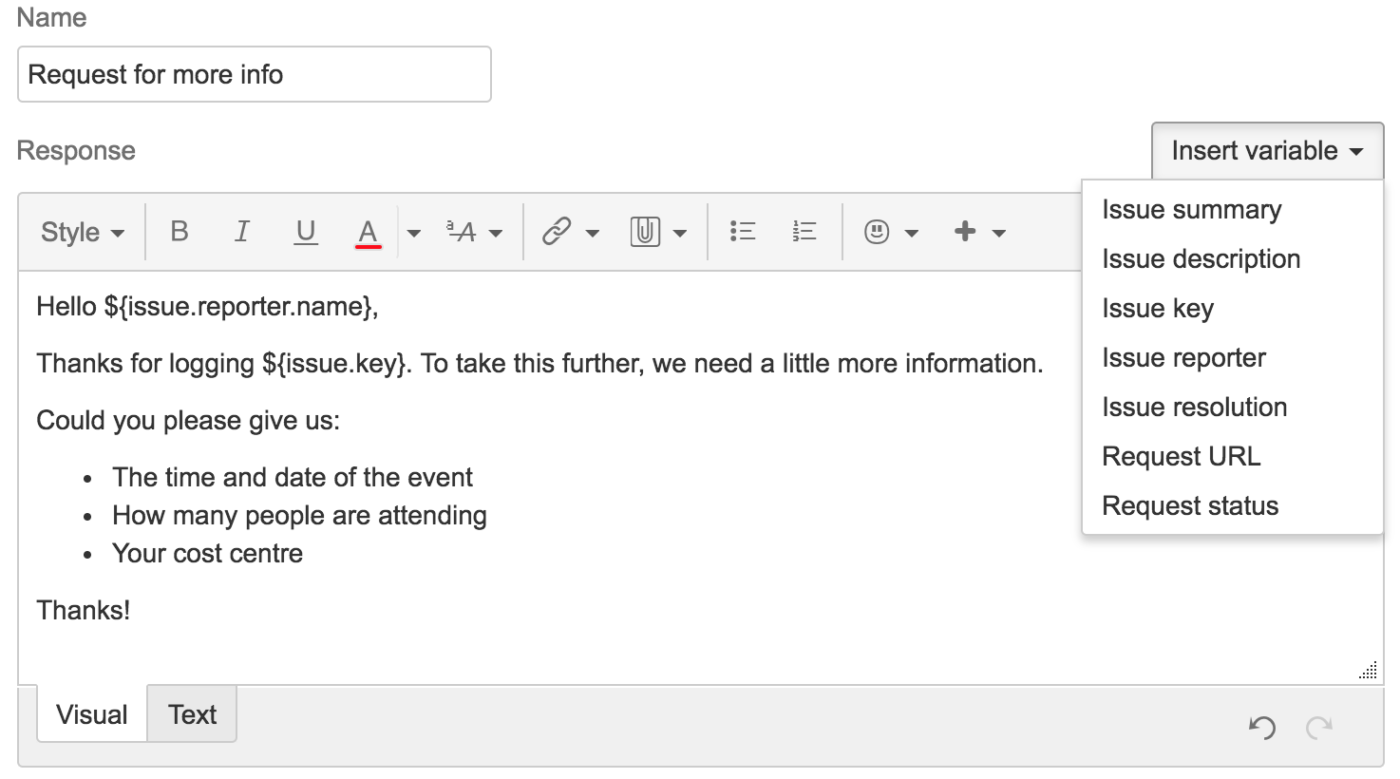
We introduced canned responses back in Jira Service Desk 3.7 and since then, the team has been hard at work making them even more powerful. Missed the memo on canned responses? Canned responses allow you to create, edit, and manage responses that can be used at any time directly from the view issue screen. All agents in your project have access to the saved canned responses so your teammates can take advantage of your saved responses, and you can take advantage of theirs. Collaboration for the win! Now, we’ve made it possible for you to add variables to your response. Want to add the issue key? Go ahead, and while you’re at it why not personalize the response by adding the reporter’s name? You’re welcome.

Automated approvals to save you time
Efficiency is key to running a great service desk, and there’s no better way to improve that than with automation. In the latest release, we’ve implemented a THEN clause which allows you to automatically approve or decline requests when they meet certain criteria.
For example, you may decide that any hardware requests created for an item that costs less than $20 are automatically approved, or any software requests over $10,000 are automatically declined. This frees up your agents to deal with the more important requests that need attention. In the example below, we’ve set up a rule for our customer reimbursement requests, and if the customer value is under $50, the request is automatically approved.

Live monitoring to help you optimize
We’ve also introduced live monitoring with JMX to help you make better decisions about how to maintain and optimize machine resources. JMX lets you monitor your Jira instance in real time using objects called MBeans to expose data and resources about your application. You can check the number of requests Jira has to deal with, the total response time, details about your license, or even the number of issues your users have created since the beginning of time.
For large instances, enabling JMX allows you to easily monitor the consumption of application resources to help you make better decisions about how to optimize your resources, or troubleshoot an issue that’s been bugging you about your instance.
There’s a whole host of other cool improvements in this release such as better security with security headers (X-Frame-Options and CSP) that either block embedding or require some extra rules to do it, support for all the languages supported by the Jira platform (which now brings the total number of languages supported by Jira Service Desk to 20) and bunch of fixes that improve the performance and stability of both Server and Data Center. Check out the release notes to learn more.

