Gantt chart maker for better project management
A Gantt chart maker offers a structured format for building effective Gantt charts, enabling project management teams to visualize and collaborate on tasks more efficiently. Here’s how a Gantt chart maker can elevate the success of your projects and how you can use a Gantt chart maker in Jira for free.

What is a Gantt chart maker?
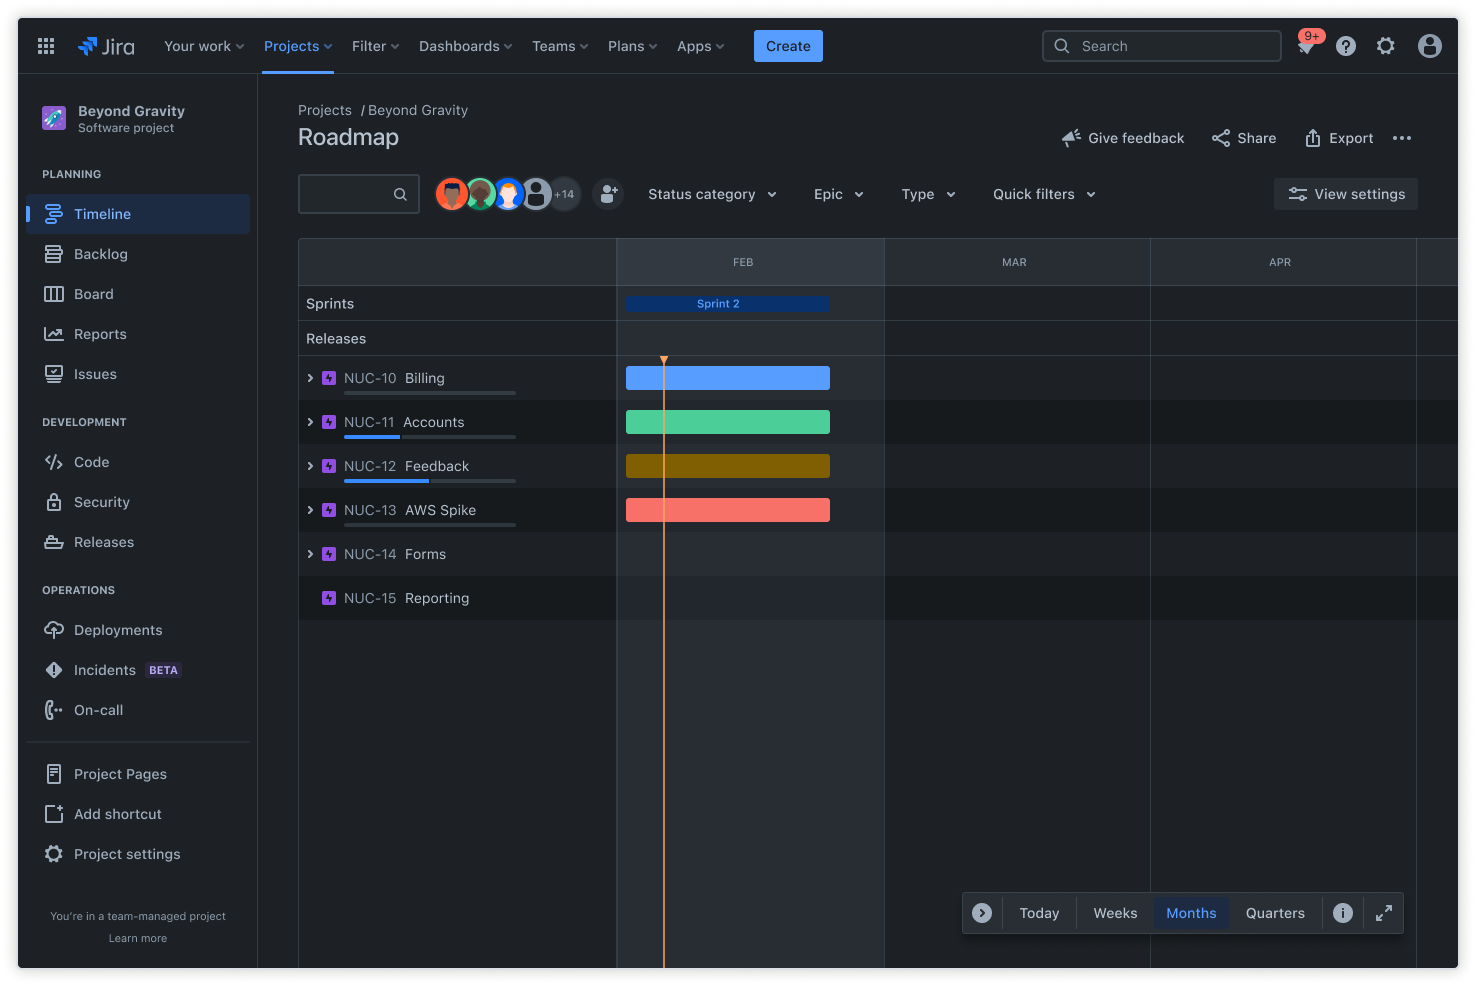
A Gantt chart provides project management teams with clear, actionable visualizations of a project’s key elements, including the project scope, project timeline, tasks, milestones, and dependencies. A Gantt chart maker is a tool with a structured format that helps you and your project teams seamlessly create Gantt charts and maximize their value.
Benefits of using a Gantt chart
Using a Gantt chart maker enhances the benefits of a Gantt chart, improving project planning and making roadmaps clearer for project teams and stakeholders. Here are some of the advantages:
Visualize your project
Gantt charts give stakeholders and project managers a high-level overview of all project tasks at a glance. A Gantt chart maker enables project teams to easily create, share, and collaborate on the visual representations of each task and project element.
Streamline project planning
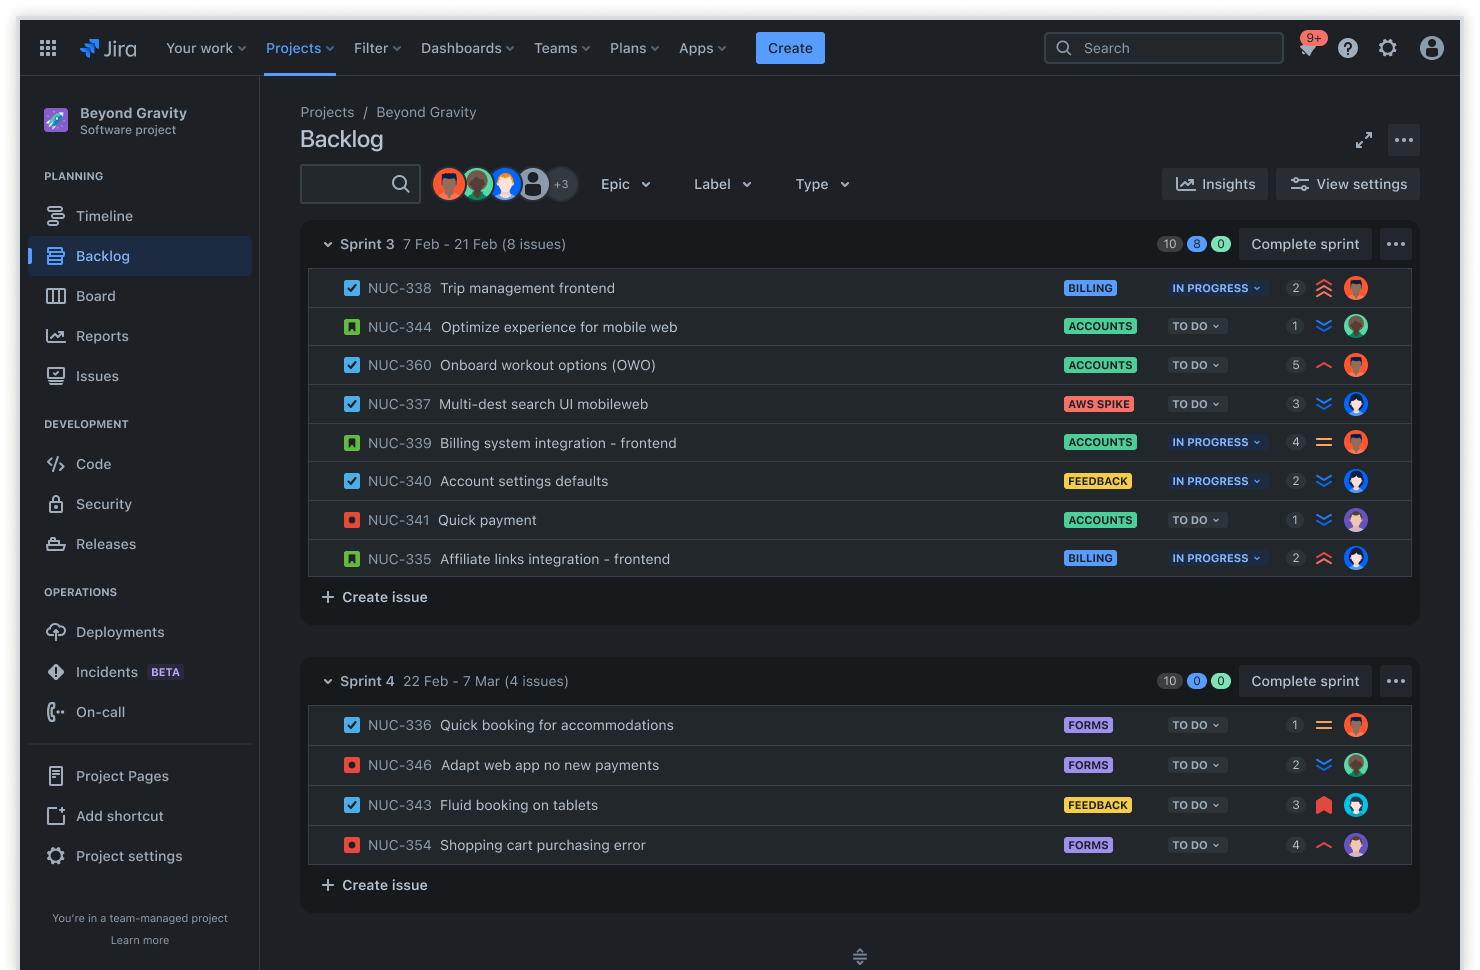
Gantt charts make it easy to visualize project milestones and deliverables and plan around dependencies and deadlines. A Gantt chart maker helps coordinate multiple workstreams to reduce or eliminate conflicting resource commitments. Streamlining features like this can be particularly useful during sprint scheduling or sprint planning.
Track progress
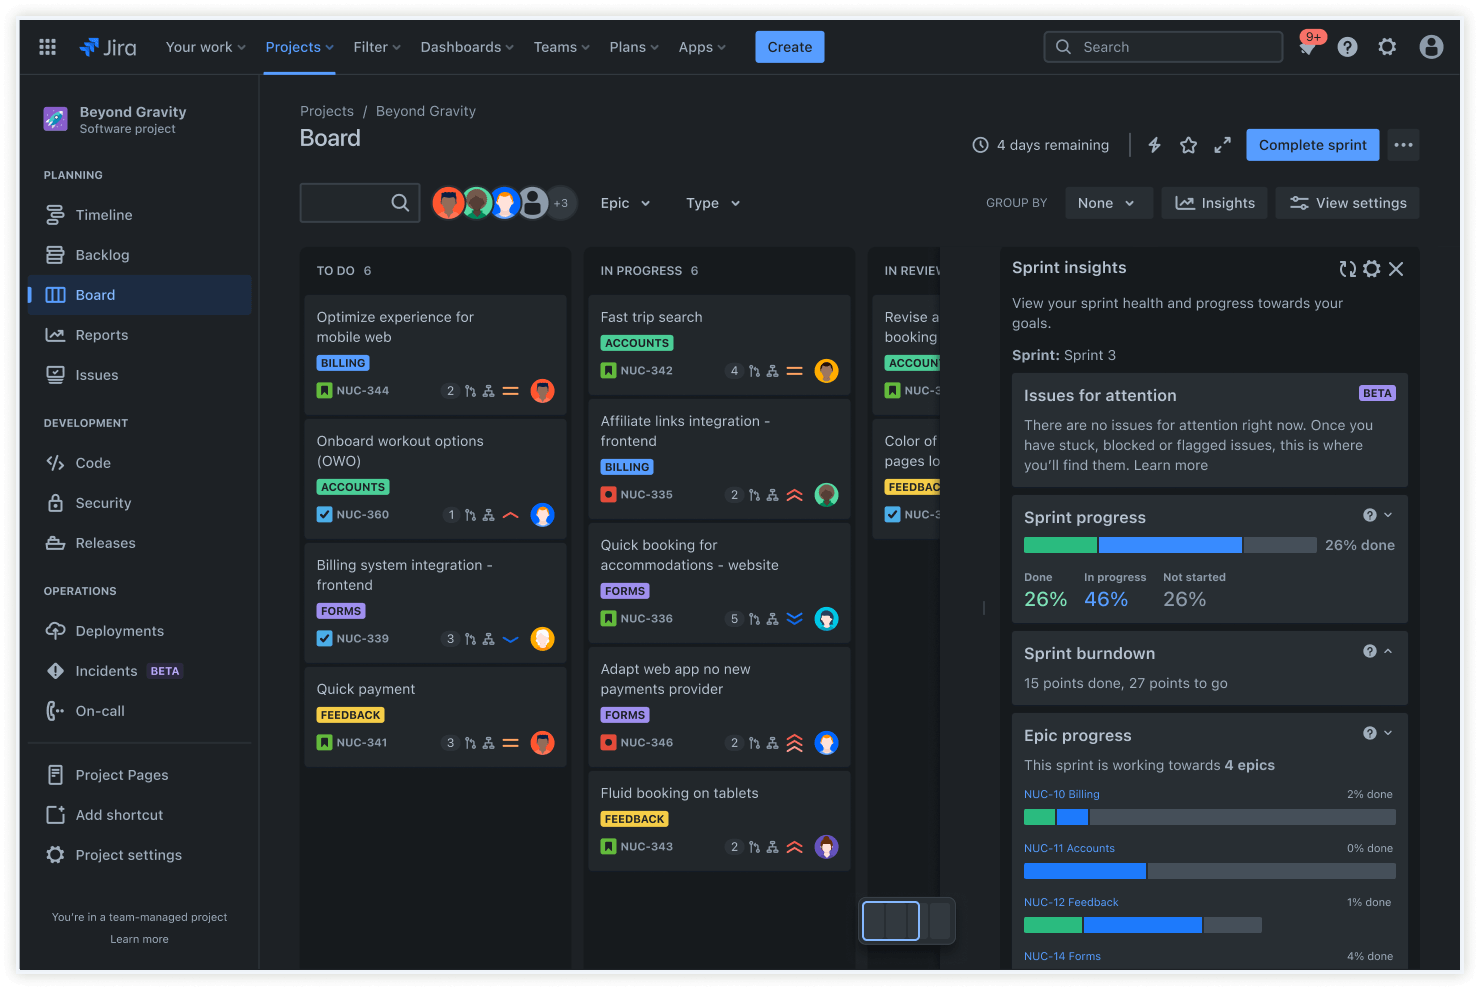
Gantt charts provide real-time insights into whether a task is on track or at risk. A Gantt chart maker lets your teams monitor project progress more closely to pinpoint and resolve potential roadblocks swiftly.
Collaborate with team members
Gantt charts are collaborative by nature, enabling team members to manage their own work while seeing how their tasks contribute to collective goals. Gantt chart makers like Jira boost collaboration by allowing teams to contribute to project plans in real-time. Team members can review and update task statuses, comment on tasks, and share files and knowledge all in one place.
Ensure project success
Using Gantt charts promotes a culture of transparency and accountability. The sharing and collaboration features of a Gantt chart maker enable project teams to see and understand the bigger picture more efficiently. This helps teams prioritize work and sets them up for success.
Key features of a Gantt chart maker

Timeline views within Jira let teams and stakeholders view project timelines on different scales, including daily, weekly, and monthly. Using a Gantt chart maker, your project teams can also customize date ranges and views to improve the clarity and alignment of timeline elements.

A Gantt chart maker allows your project teams to organize tasks hierarchically, assign priorities, and set dependencies for specific tasks and resources. These features make project workflows more transparent and efficient to manage.

A Gantt chart maker provides immediate visibility into project status, resource allocation, and task dependencies. This visibility powers faster and better-informed decision-making, leading to more consistent project success.
Best practices for using a Gantt chart maker
Mastering best practices for using a Gantt chart maker maximizes its value to your project management efforts. Here’s how to use a Gantt chart maker:
- Implement clear task definitions and dependencies. Confirm that your project team members understand and agree with all definitions and dependencies.
- Update task progress and milestones regularly. Ensure that your project teams quickly identify and resolve any actual or potential disruptions to project timelines.
- Communicate changes promptly and transparently to team members. Where appropriate, communicate regularly with affected stakeholders to set their expectations accurately.
Try the Gantt chart template.