Gantt chart software for project management
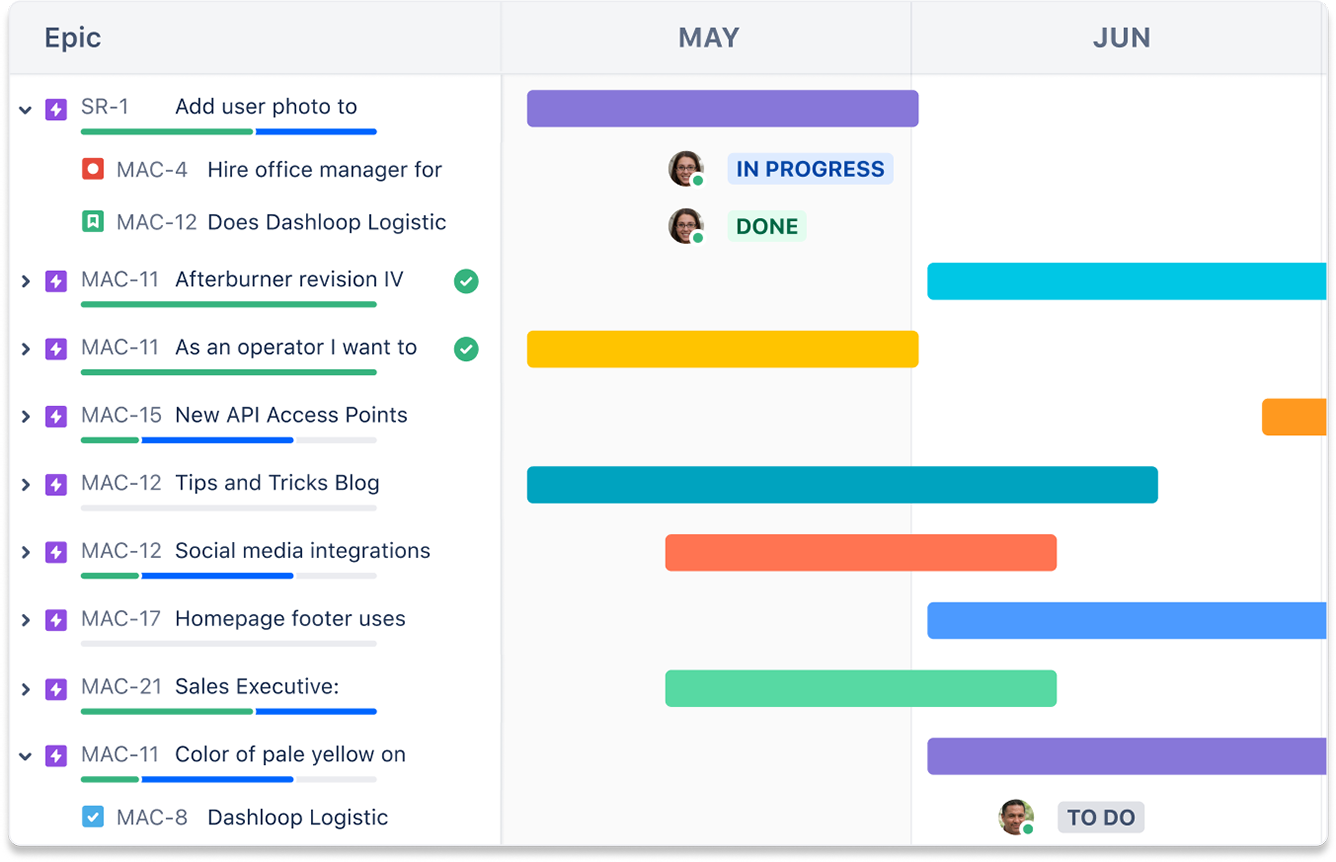
Tracking complex projects with large teams and multiple tasks can be challenging for any project manager. Gantt chart software, an agile project management tool, helps simplify the job by providing a visual approach using horizontal graph bars representing each task and milestone in your project.
Why teams use Gantt chart software
Gantt charts serve as a visual reference point for all work down to the task level and benefit the entire team. The tasks include start and end dates, resource assignments, dependencies, progress, and milestones.

When integrated with product development tools, such as Jira, task-level changes get reflected immediately, providing the current view of the entire project.
Task scheduling
Scheduling tasks helps the team and stakeholders know what to expect and when, and Gantt chart software defines clear start and end dates for each task.
Dependency mapping
Task dependencies occur when one task cannot begin until another is complete. Assigning dependencies becomes easy with tools for mapping and visualization, such as Gantt chart software that simplifies task sequencing, prevents downtime, and optimizes team resources.
Project tracking
Gantt charts provide a current view of a project’s status, open and completed tasks, dependencies, and bottlenecks. As teams log progress against tasks, Gantt chart software tracks project progress to completion in real time.
Date shifting
Adding new tasks to an existing project can result in a cascade of shifting dates when those tasks have dependencies. Gantt chart software automatically adjusts dates for all dependent work when tasks are added or changed.
Resource allocation
Efficient project management optimizes resource allocation by focusing on skills, availability, and constraints. Gantt chart software visually represents all resources across the project timeline, showing when they are needed and how long they will be working on each task.
Roadmap views
Project managers rely on visual roadmaps to clearly communicate the vision, priorities, and progress of the project with everyone. Advanced and basic roadmap views in Gantt chart software help tailor the information by providing the right level of detail for the audience.
Limitations of Gantt charts
Gantt charts are beneficial in visually representing projects in real time. However, as projects become more complex and the team grows, Gantt charts can quickly become overwhelmingly complex. It’s important to find a tool that allows the team to quickly and easily drill into details to understand priorities, dependencies, and the amount of work each task requires.
Gantt chart software for agile teams
At its core, a Gantt chart aims to promote greater flexibility, collaboration, and customer-centricity. Gantt charts, or tools that offer Gantt chart-like capabilities such as Jira, can be used by Agile teams practicing Scrum or Kanban methodologies.
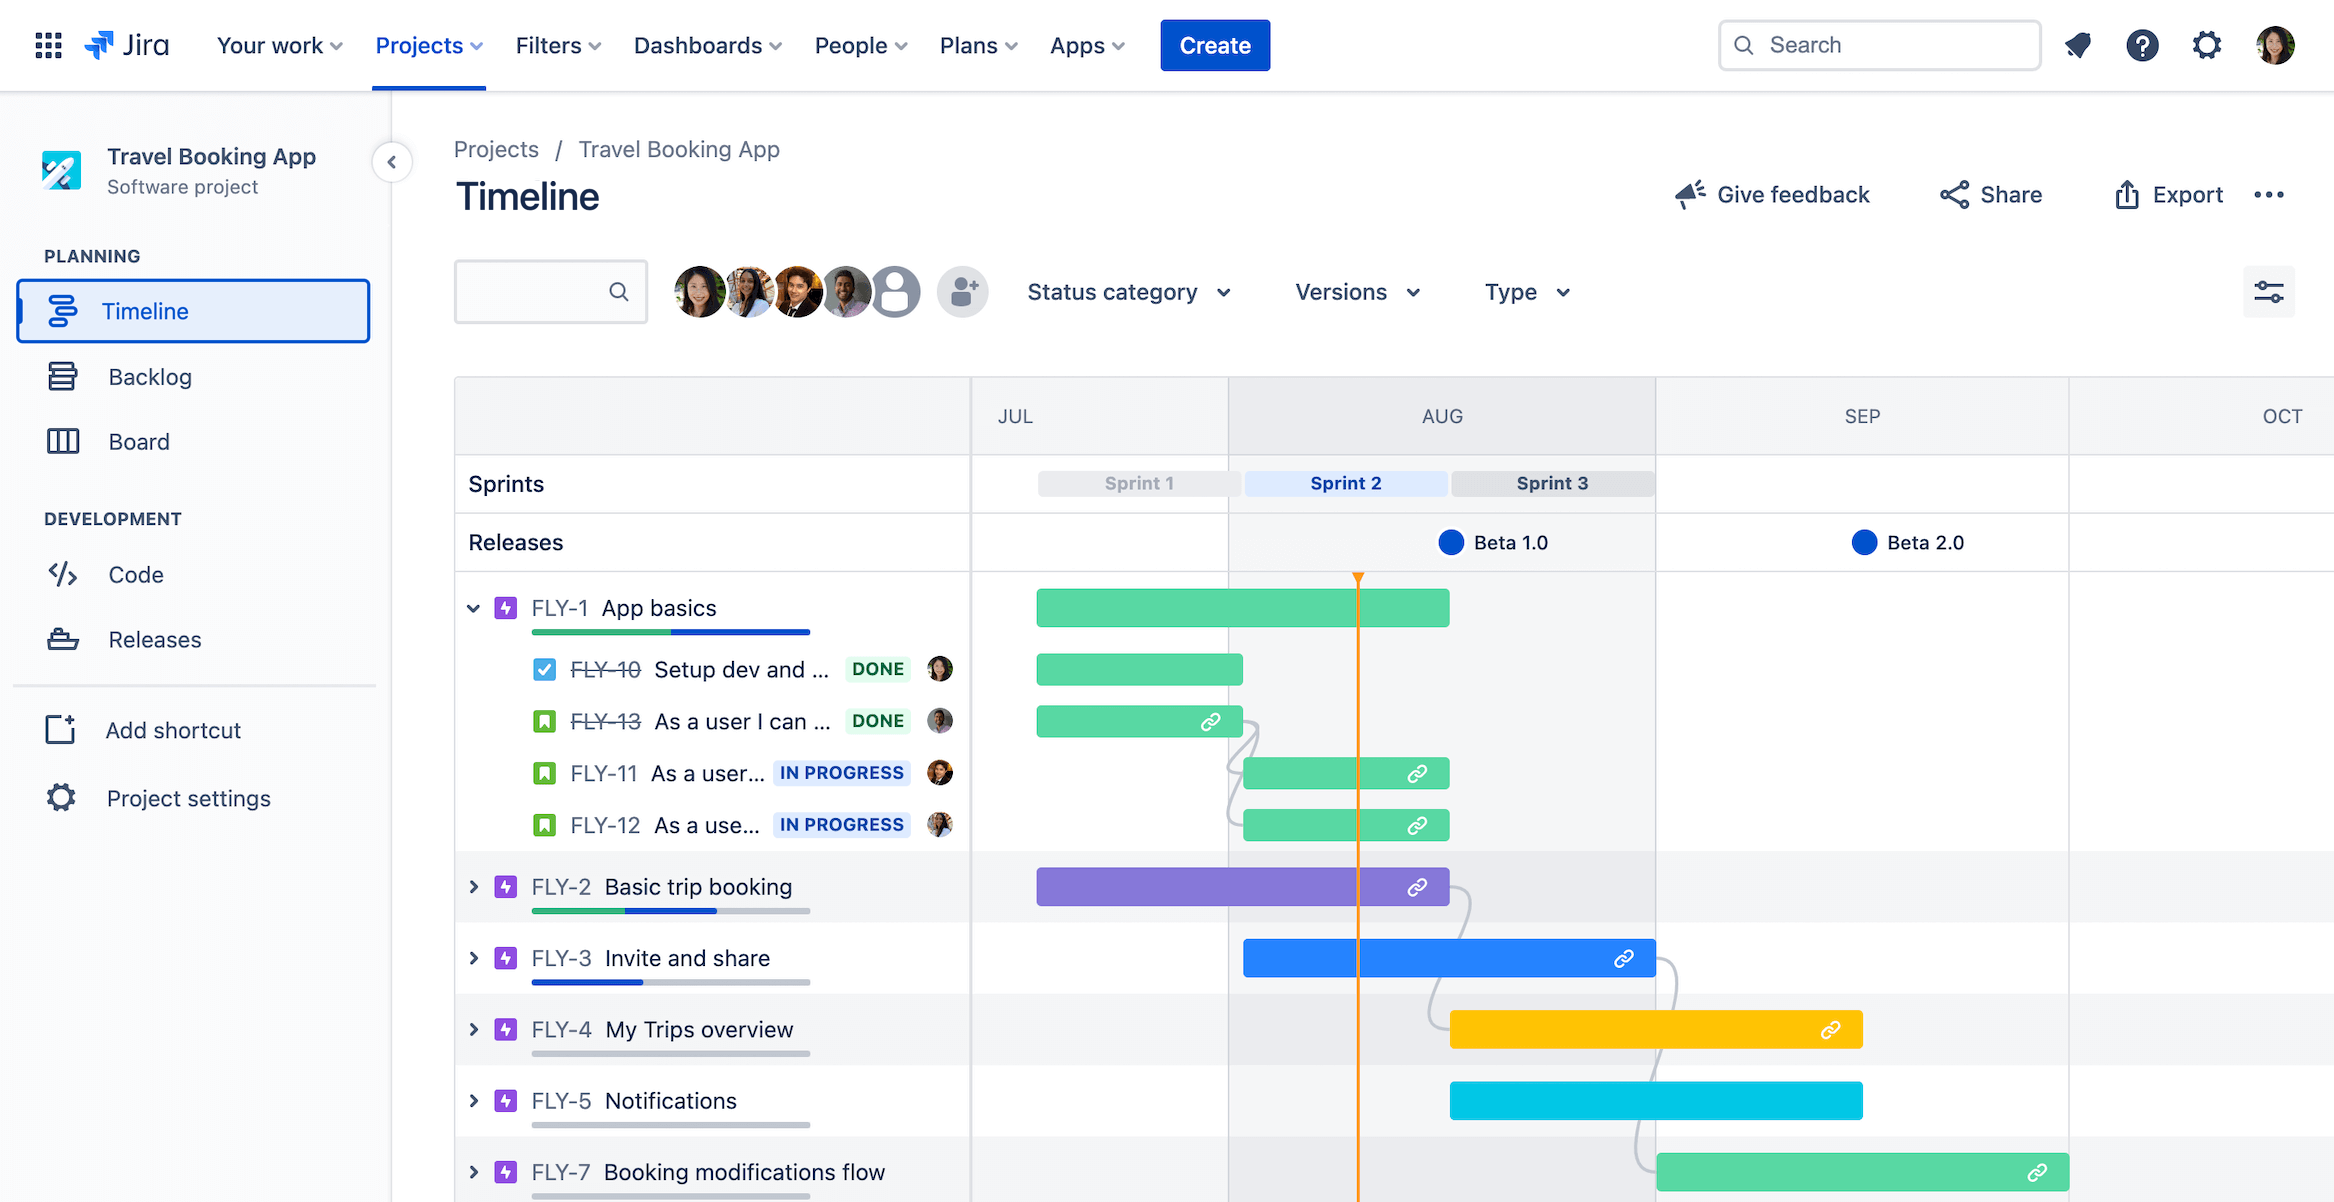
Jira’s Timeline view allows individual teams to visualize the timing, duration, and dependencies of tasks within a project. The timeline offers a simple way to plan your project with respect to important dates and deliverables. Map dependencies within your team to identify and account for potential blockers in your project plan. Keep your teams and stakeholders in sync with software designed to help you release more predictably, pivot with agility, and stay aligned to the big picture goals.
This is a powerful view for teams across the organization. For example, marketing teams can visualize all the tasks related to a specific launch, while software development teams can see the same detail for the next feature they’re building.

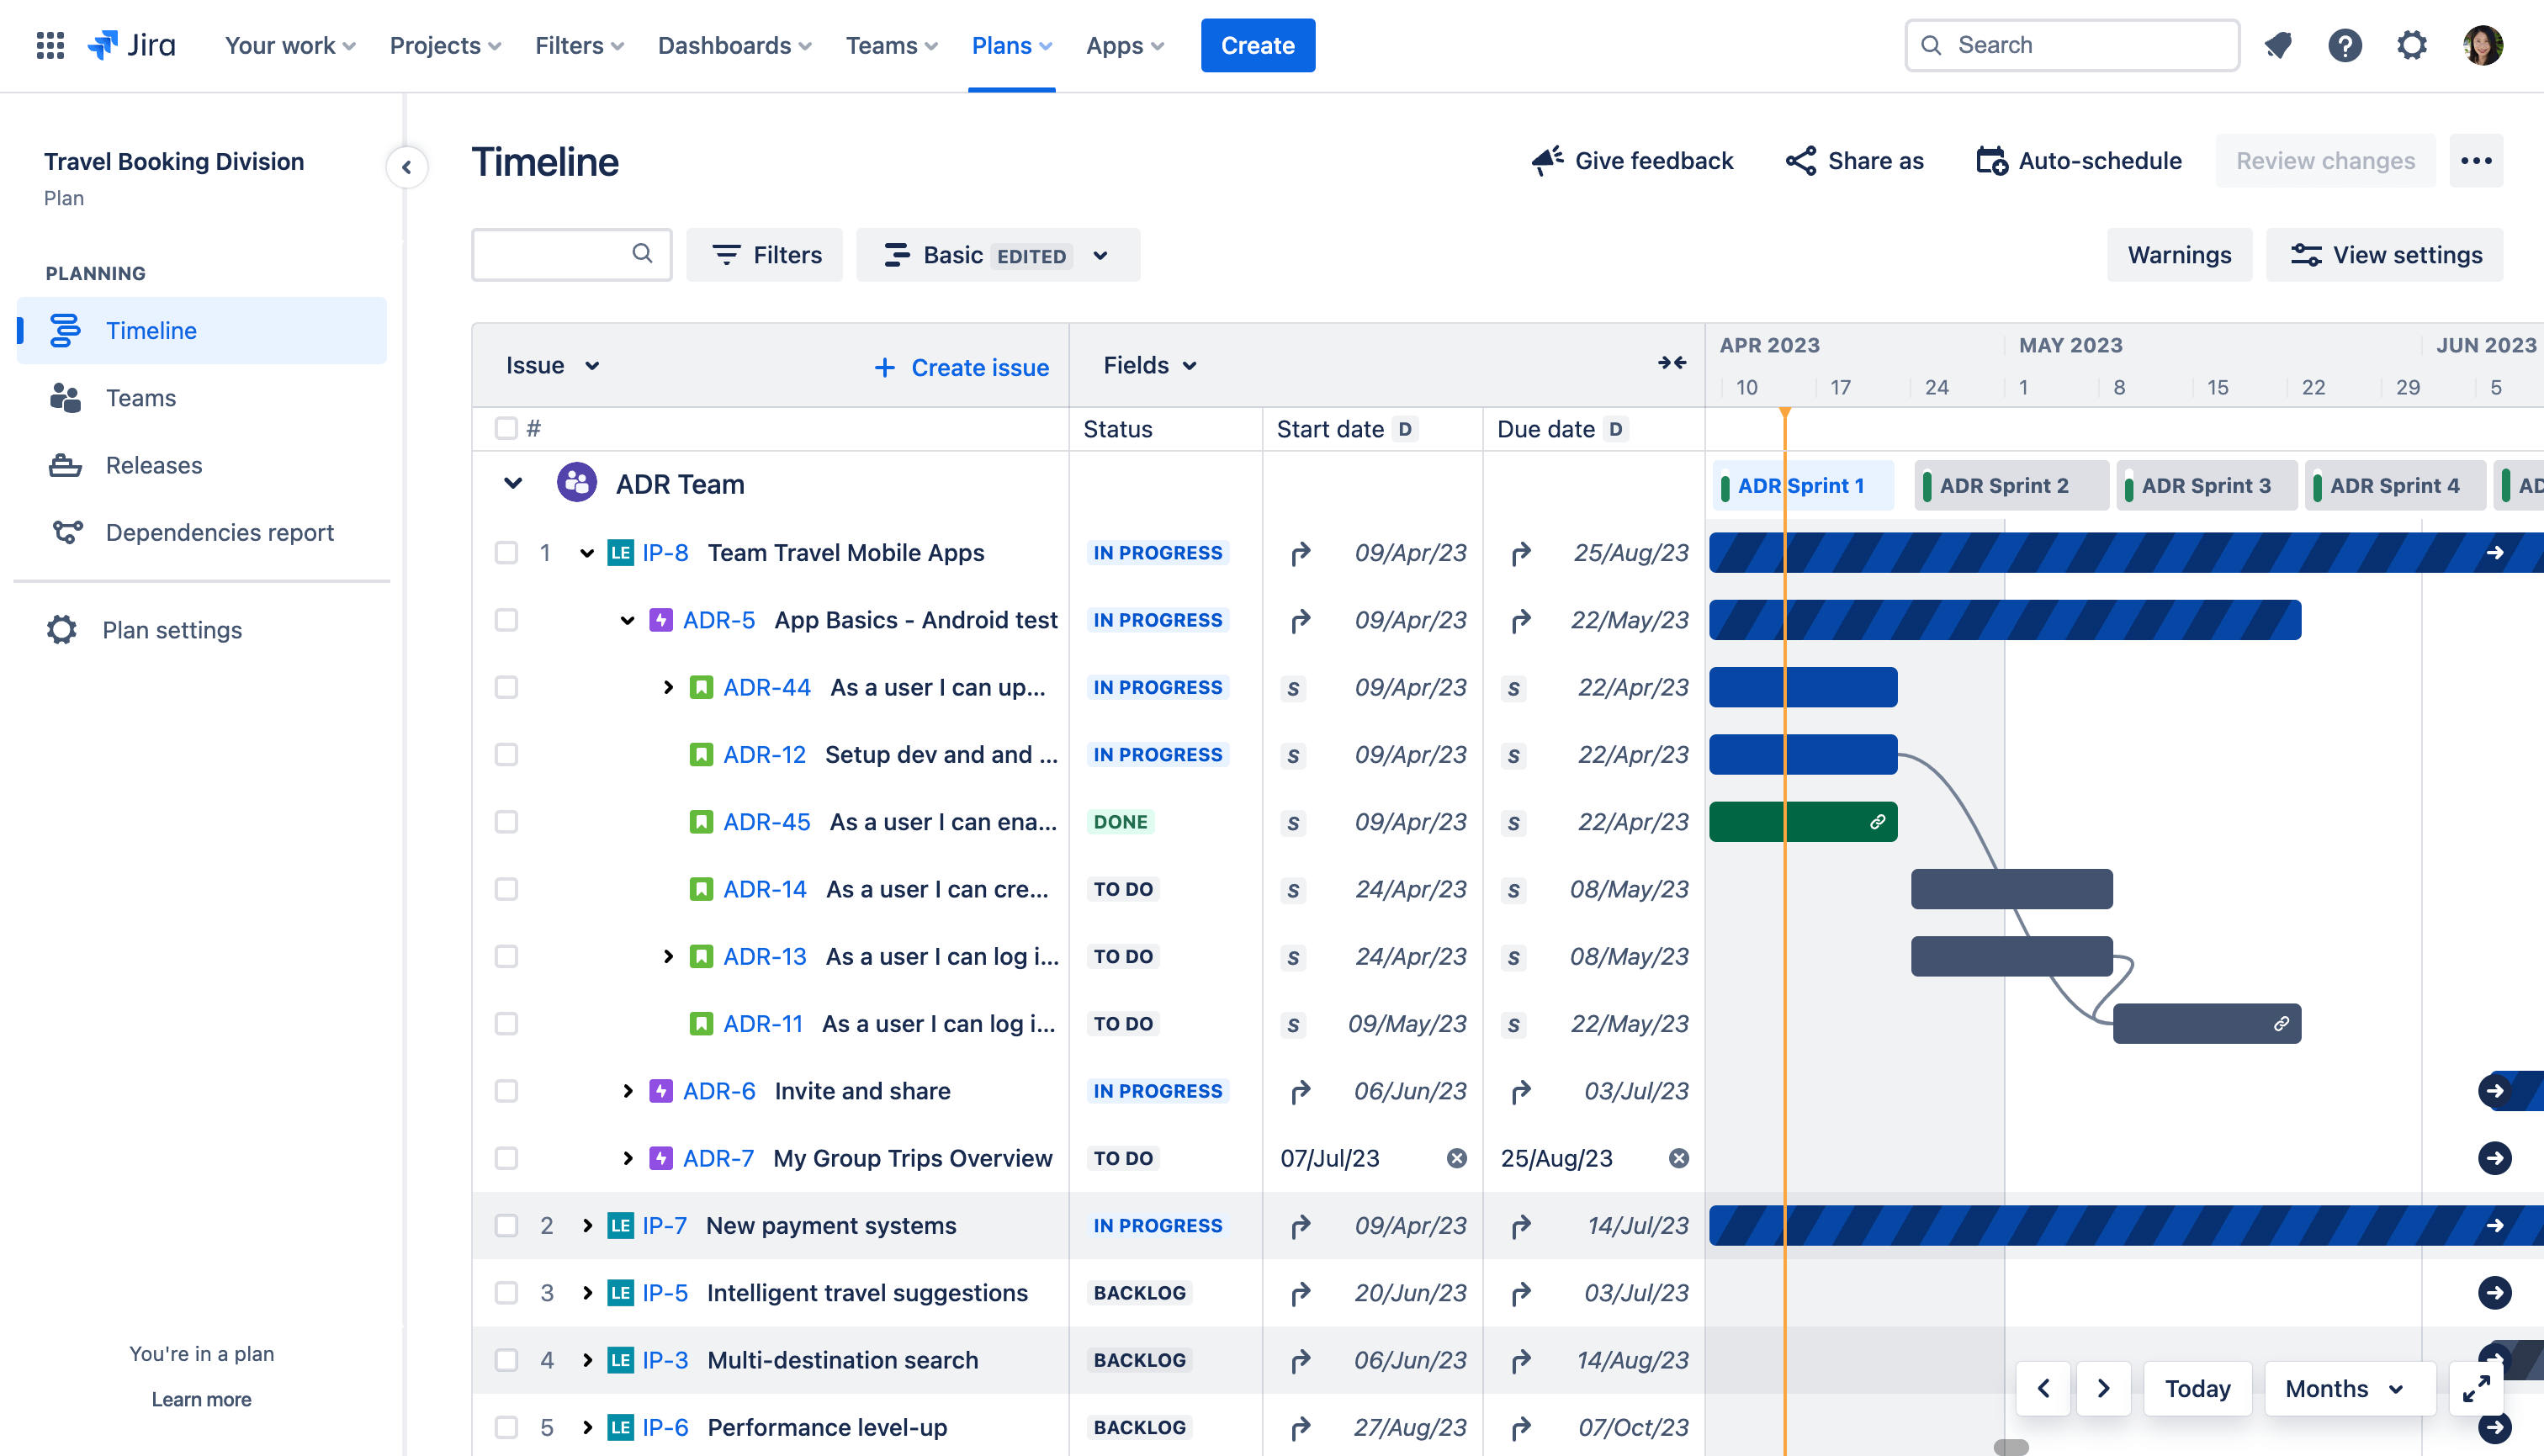
Plans is an advanced planning feature available in Jira Premium. Where the Timeline visualizes work from within a team, Plans allows organizations to ladder work from multiple teams and projects to company-wide initiatives. This simplifies data sharing between teams and improves resource optimization and release date scheduling. Plan at the organizational level based on capacity, track dependencies, manage competing priorities, and explore alternative scenarios with a single source of truth on the current and future health of your initiatives.
