Advanced reporting and analytics
Gain insight into areas of success and opportunities for improvement. Opsgenie tracks everything related to alerts and incidents. Use powerful reporting and analytics to reveal the source of most alerts, your team’s performance in acknowledging and resolving, and how on-call workloads are distributed.
Operational efficiency analytics
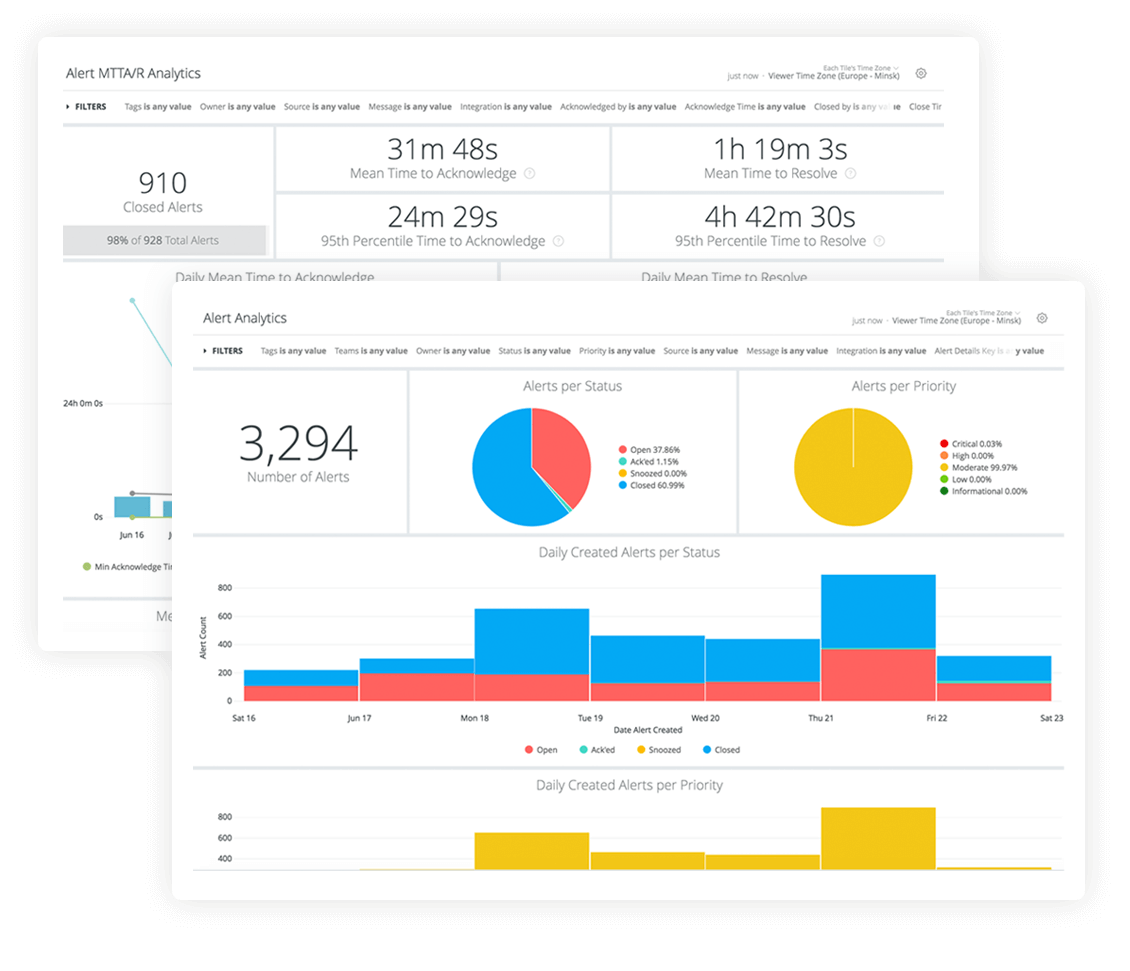
Instantly understand the volume of alerts your company has handled over a specified period of time, and the corresponding mean-time-to-acknowledge and mean-time-to resolve. You can easily visualize how these metrics are trending over time and with a mouse click, drill down into areas of concern to understand which alerts required more time and attention.
Monthly overview analytics
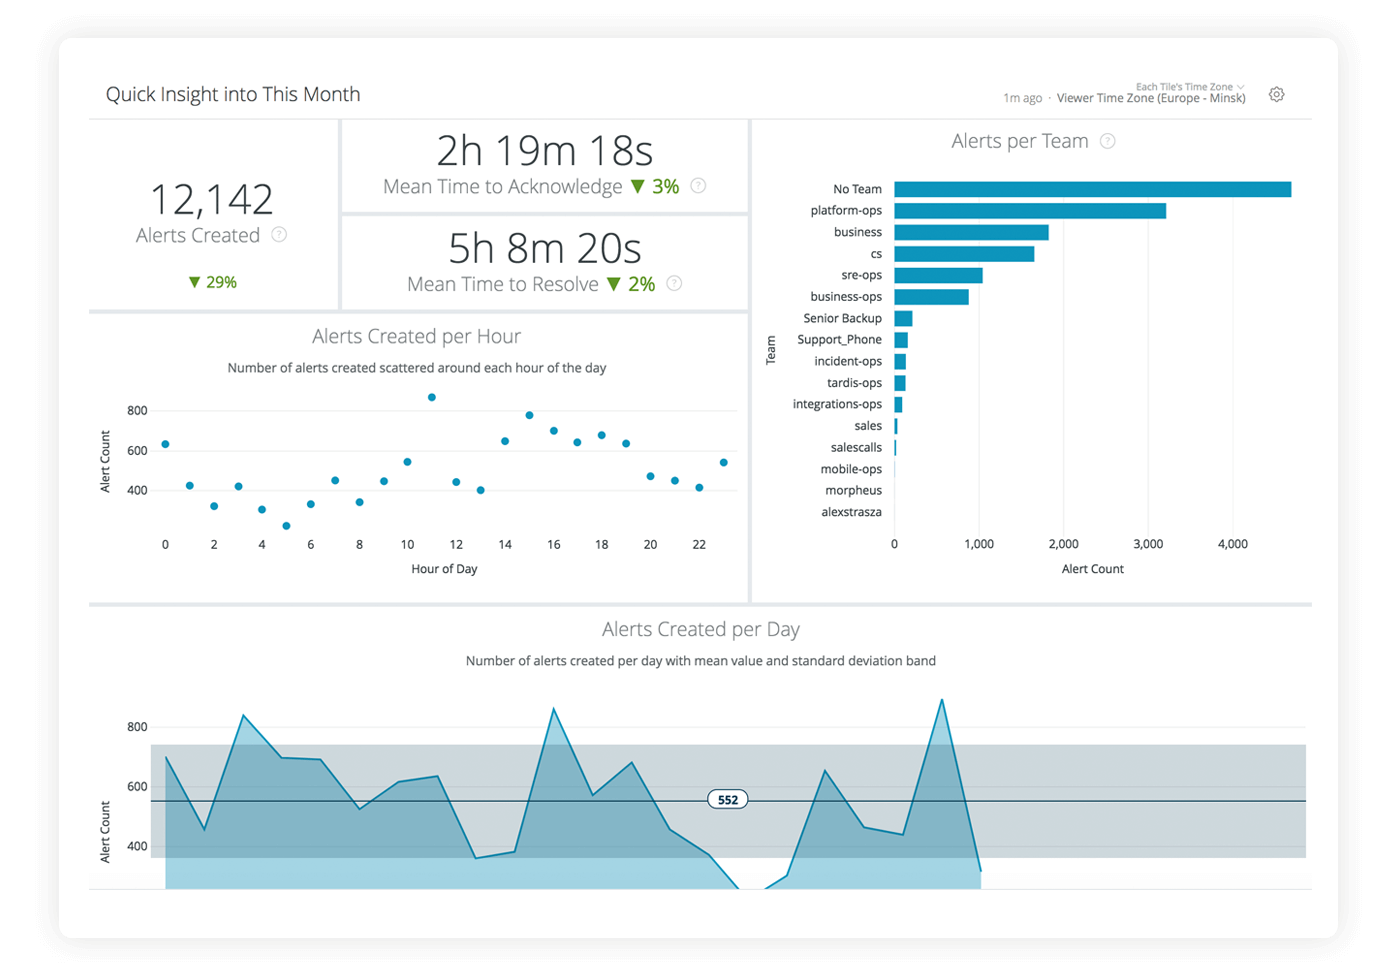
Use Opsgenie’s standard dashboard to analyze the monthly alert distribution and response trends. You can easily compare them with the previous month, and drill into any areas of interest.
Reports you can download and schedule
Easily share data and communicate findings by exporting reports in various formats including PDF. You can even instruct Opsgenie to email the reports to peers on a regular schedule.
User and team productivity analytics
Automatically group related alerts originating from across various systems into a single incident based on the conditions that you specify. Reduce complexity and noise to let your responders focus on the right context and resolve problems quickly.
On-call analytics
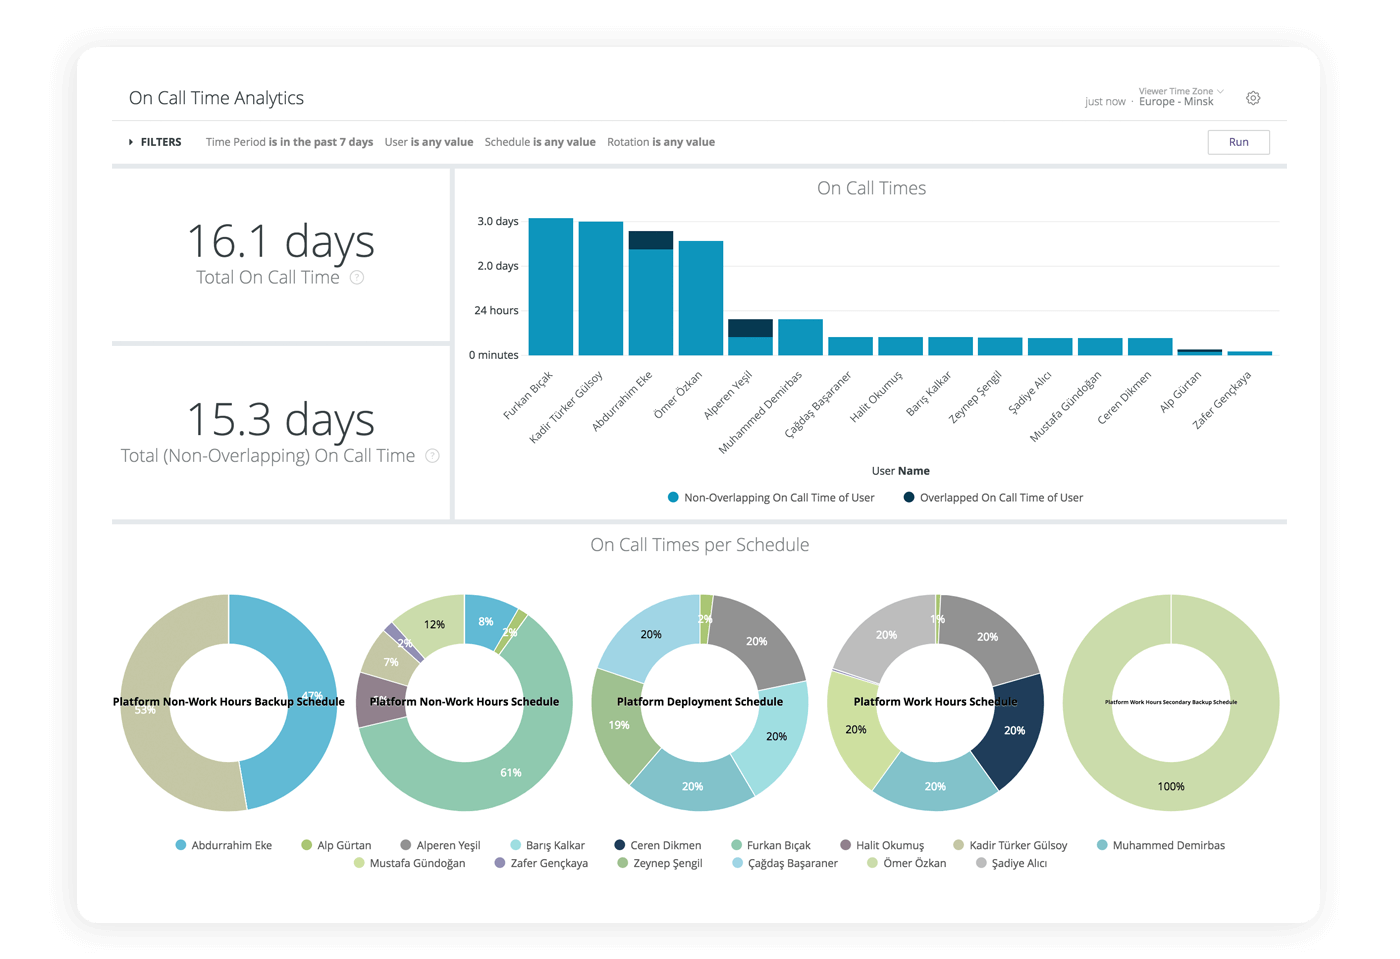
Understand how on-call workloads are distributed throughout each team. Ensure that teams are balanced and working at peak efficiency.
Conference attendance and efficiency analytics
Conference participation is often the key to fast incident resolution. During and after an ICC conference, you can analyze team participation in detail. Understand the attendance and efficiency analysis for each Incident Command Center session.
Service and infrastructure health reporting
Quickly get a top-level view of all services and identify any problems or weaknesses, realize the system and process flaws, and potential improvements.
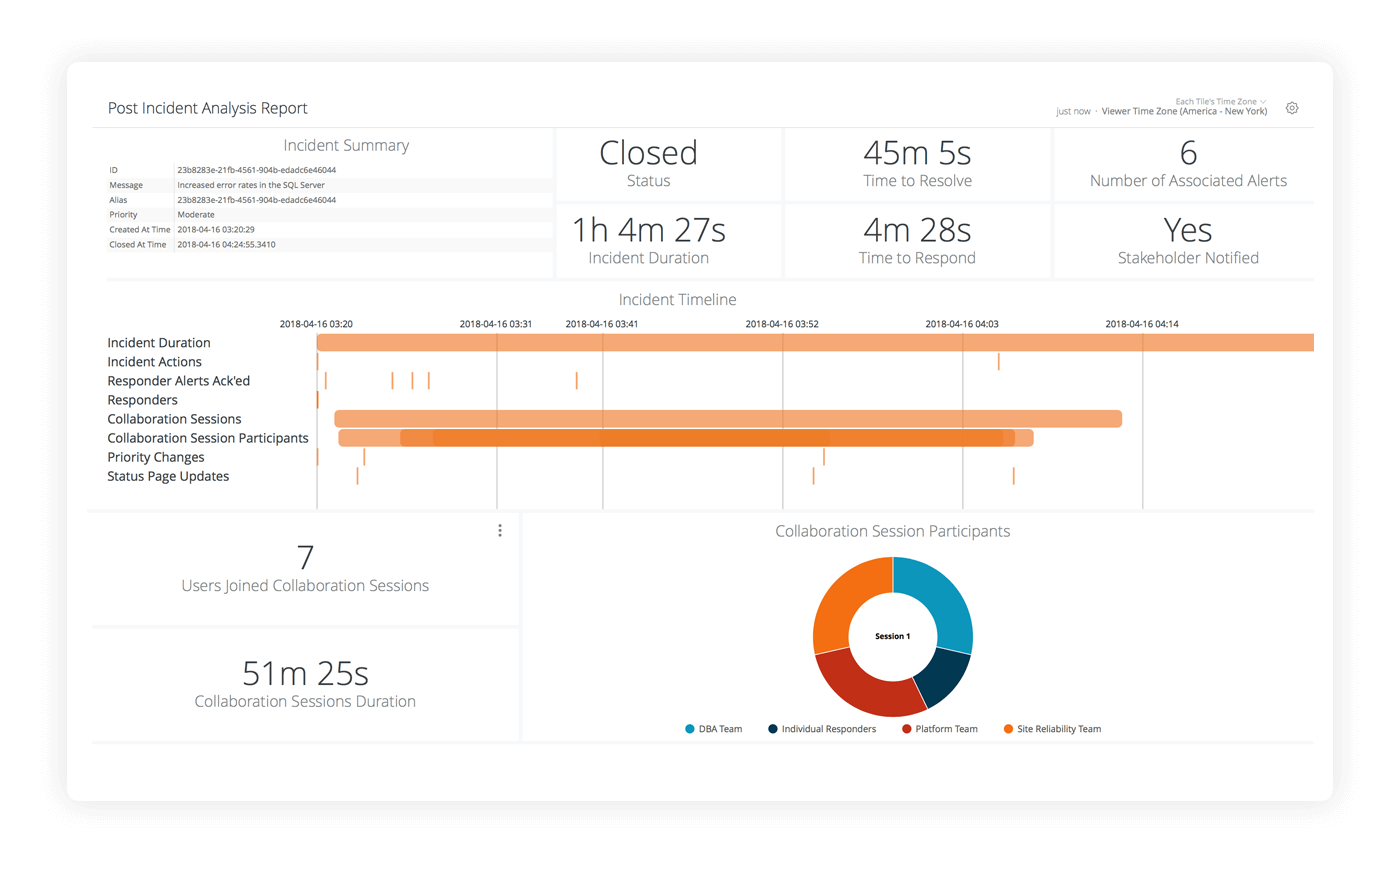
Post-incident analysis reporting
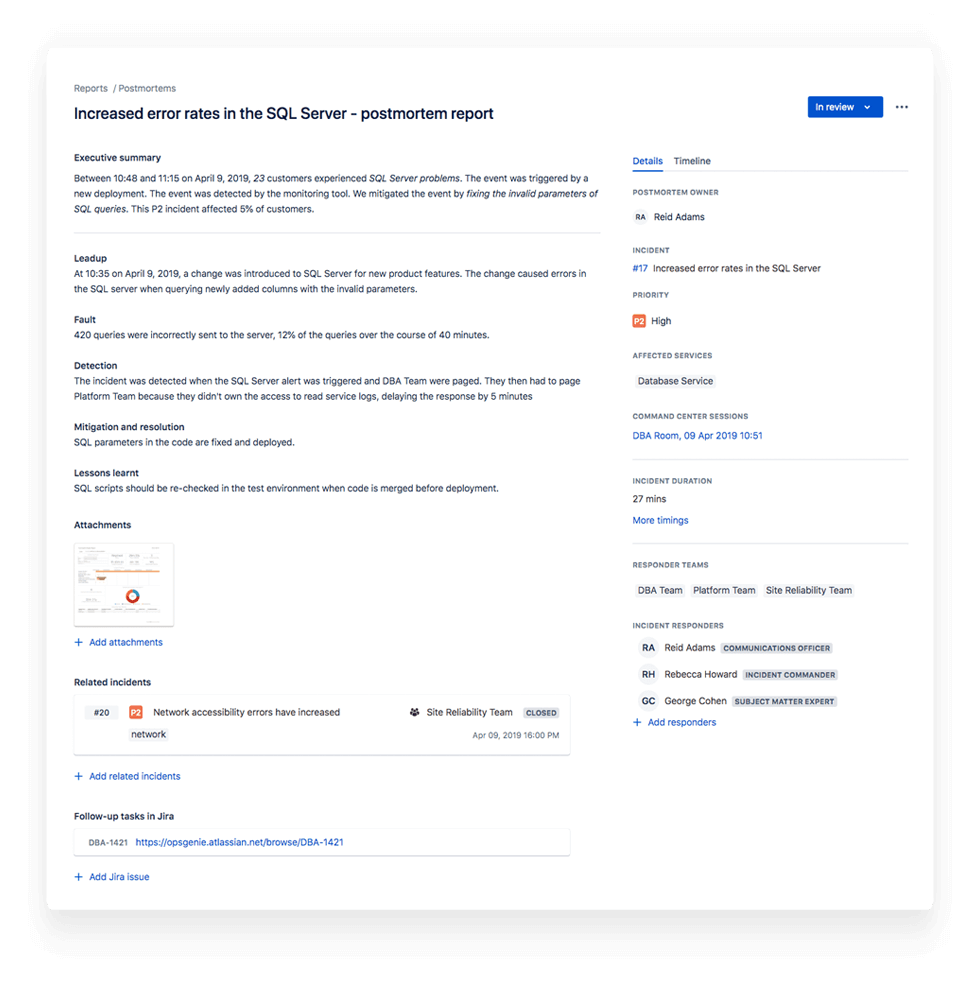
As each major incident is resolved, use the post incident analysis report to understand the actions taken and their timing. Identify how fast people acknowledged the issues, when status changes were communicated, and how teams participated in the resolution. Easily compare different incident responses, to identify opportunities for improvement.
Postmortem Reports
Opsgenie’s Postmortem report summarizes the key information related to an incident in a consistent, easy-to-read format. Users can edit, add notes and document lessons learned while creating a comprehensive incident report.
