Close

Using Confluence whiteboards for embedded diagramming

Confluence whiteboards are where ideas come to life in an organized and polished way while maintaining the freeform, creative spirit of collaborative brainstorms.

With whiteboards, you can post ideas then connect and arrange them visually to form timelines, workflows, strategy and product breakdowns, and more. You can also create diagrams using shapes to represent different ideas and elements, then connect them with lines and arrows to show how they relate.

Diagrams are valuable tools for organizing work, aligning teams, and presenting plans and concepts clearly and efficiently to internal and external stakeholders. When used in combination with detailed plans, diagrams often let you paint the connected picture of the work you’re doing supported by rich context.

In this guide, find out how to create diagrams in whiteboards you can share on Confluence pages.


When, why, and how to incorporate diagrams in pages

Having whiteboards and pages both as content types within Confluence makes using them together a seamless experience. No more using different tools or disconnected systems that force you to recreate diagrams from scratch or copy and paste them from one place to another, risking all your previous formatting work.

Embedding a whiteboard with a diagram into a Confluence page means you always have the precise visual exactly where you want it. Even better, any changes made to the original diagram in the whiteboard will automatically update wherever else it’s shared. You can even customize what part of a whiteboard diagram you embed by linking to a section or individual object.

Here are some instances when leveraging whiteboard diagrams in pages is particularly useful:

Diagramming flows

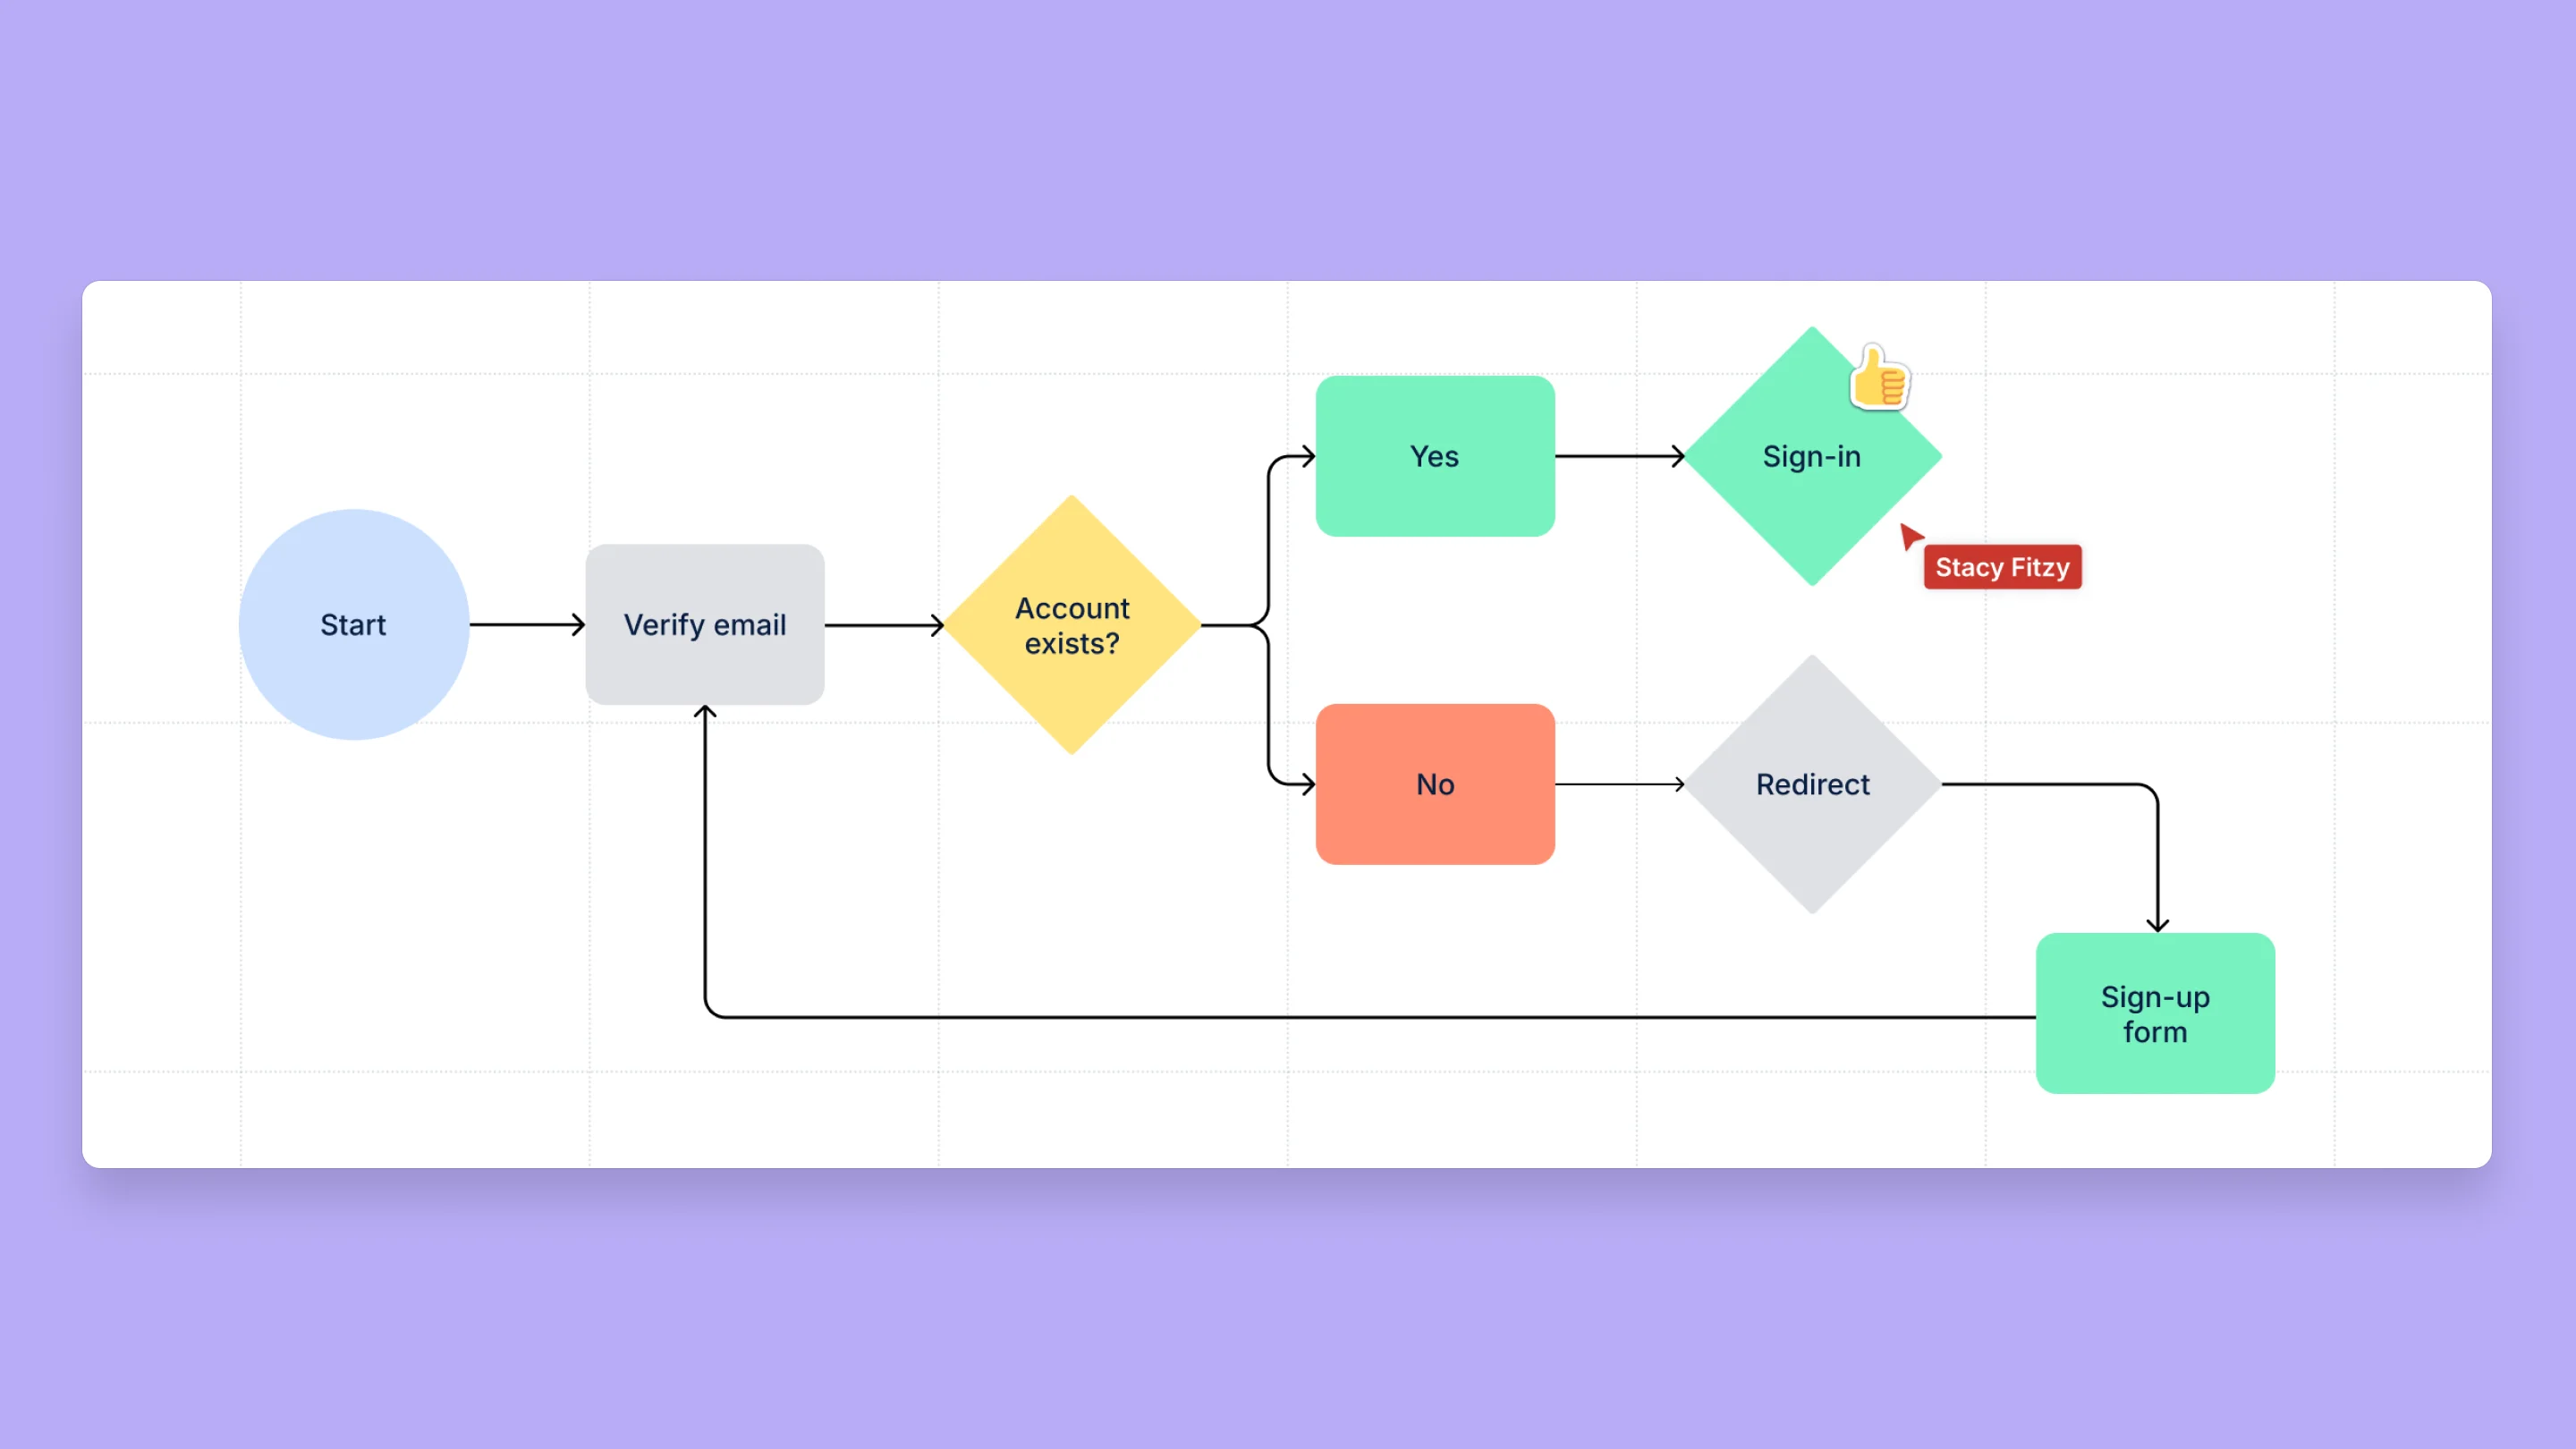
Whiteboard diagrams are great for building flowcharts. Flowcharts can visually represent a wide range of processes, workflows, and concepts. Diagramming these flows shows how they work and breaks down all the steps involved and how they’re connected.

스크린 샷

Once you diagram different flows in whiteboards, you can add them to relevant pages, for example:

  • Product development timelines in product roadmap documents
  • User engagement journeys in product development and audience research documents
  • Company-wide, departmental, and team decision making processes

Building project plans

Project management plans can be elaborate and complex with many moving parts. Diagrams help conceptualize and organize them into manageable, easily digestible pieces. Some examples of diagrams you can integrate into project planning documents include:

  • 주요 프로젝트 마일스톤 및 산출물의 순서 및 지정된 기간을 요약한 프로젝트 타임라인
  • 모든 개별 요소 및 소유자를 세분화한 프로젝트 범위 다이어그램

마케팅 전략 개발

다이어그램은 대상 그룹 조사, 고객 여정, 캠페인 타임라인 등을 나타내는 데 유용합니다. 마케팅 전략 설명서에 다이어그램을 통합한 몇 가지 예시는 다음과 같습니다.

  • 퍼널의 각 단계에 다양한 캠페인 및 이니셔티브를 연결하는 마케팅 퍼널 다이어그램
  • 대상 그룹의 인구 통계, 행동, 요구 사항, 불만 사항을 요약한 고객 페르소나 다이어그램
  • 여러 작업을 일정으로 세분화한 캠페인 타임라인 다이어그램
스크린 샷

페이지 내 화이트보드 다이어그램의 주요 특징 및 이점

공동 작업 워크플로에 다이어그램을 추가하는 것의 핵심은 Confluence 페이지에 화이트보드를 연결하고 포함하는 방법을 아는 것입니다. 다이어그램이 있는 전체 Confluence 화이트보드를 페이지에 포함하려면 화이트보드 URL을 복사하여 페이지의 원하는 위치에 링크로 붙여 넣기만 하면 됩니다. Confluence는 링크를 화이트보드의 포함된 보기로 자동으로 변환합니다.

다이어그램의 특정 부분을 화이트보드에 포함하려면 섹션 또는 개체 링크를 복사해야 합니다. 화이트보드에서 섹션, 도형, 선 또는 스티커를 마우스 오른쪽 버튼으로 클릭하고 "개체에 링크 복사"를 선택하면 됩니다. 그런 다음 원하는 섹션 또는 개체가 이미 확대되어 있는 URL을 화이트보드에 포함된 Confluence 페이지에 붙여 넣습니다.

스크린 샷

공동 작업 개선

화이트보드를 사용하면 프로젝트의 모든 작업자가 다이어그램에 기여하고 업데이트하고 상호 작용할 수 있습니다. 여러 팀원이 실시간으로 다이어그램을 편집하고 확장할 수 있습니다. 또한 다이어그램 또는 다이어그램의 특정 섹션에 설명을 추가하여 질문하고 명확하게 설명하고 관련 정보 및 업무를 알아야 하는 동료를 태그할 수 있습니다.

스크린 샷

동기화된 업데이트

페이지의 화이트보드에서 다이어그램을 연결하면 항상 최신 상태로 유지됩니다. 다이어그램에 대한 모든 편집 또는 업데이트는 다이어그램이 포함된 다른 곳에서 자동으로 업데이트됩니다.

여러 버전의 다이어그램을 쉽게 만들고 공유

복잡한 아이디어 또는 프로세스를 개발할 때는 시간 경과에 따른 다양한 상태를 나타내기 위해 여러 버전의 다이어그램을 만들어야 하는 경우가 많습니다. 기존의 다이어그램 도구에서는 원본 다이어그램의 사본을 저장하거나 원본 다이어그램을 복제하는 것만 가능했습니다. 따라서 나중에 원본 버전에 무언가가 빠진 것을 알게 되면 모든 버전을 동기화된 상태로 유지하기 위해 각각 변경해야 하는 번거로운 프로세스를 거쳐야 했습니다.

화이트보드를 사용하면 동일한 넓은 캔버스 내에서 다이어그램의 여러 버전을 만들고 관리할 수 있습니다. 축소하여 모든 다이어그램을 한눈에 보거나 확대하여 특정 버전에서 작업할 수 있습니다. 이 접근 방식을 사용하면 여러 상태 또는 버전을 나란히 놓아 더 쉽게 비교하고 세분화할 수 있습니다. 각 버전마다 별도의 링크를 복사하는 것이 가능해 헷갈리는 일 없이 문서의 특정 다이어그램을 공유할 수 있습니다.

다이어그램의 확장 가능한 중앙 집중식 소스

화이트보드를 사용하면 모든 프로젝트 다이어그램에 대해 확장 가능한 중앙 집중식 소스를 유지할 수 있습니다. 다른 도구에서는 다이어그램마다 파일이 여러 개 있어 관리하고 공유하기 어려울 수 있습니다. 화이트보드는 모든 프로젝트 다이어그램을 한곳에 둘 수 있는 유연한 하나의 위치를 제공합니다.

화이트보드를 사용하면 작업을 체계적으로 유지하고 쉽게 확장할 수 있습니다. 프로젝트가 발전함에 따라 공간이 부족해지거나 여러 버전을 놓칠 걱정 없이 동일한 캔버스에 계속 추가하는 것이 가능합니다. 다이어그램 및 기타 화이트보드 콘텐츠는 프로젝트 확장에 따라 함께 뻗어나갈 수 있습니다.


아이디어를 실행 가능한 계획으로 전환

Confluence 화이트보드 다이어그램을 Confluence 페이지에 통합하면 다이어그램을 향상하고 명확히 할 수 있을 뿐만 아니라 프로젝트에 대해 업데이트되는 정보 출처를 만들 수 있습니다. 하나의 플랫폼에서 실시간으로 다이어그램을 업데이트하고 특정 섹션을 공유하고 여러 버전을 관리할 수 있어 프로젝트가 발전함에 따라 지속적인 팀 정렬을 보장합니다.

Confluence를 사용하면 다이어그램은 단순한 정적 이미지가 아니라 전략적 도구 키트의 동적 구성 요소가 됩니다. 지금 화이트보드를 사용해 보고 Confluence에서 다이어그램을 한 단계 높여 보세요.

표를 빠르게 처리

Confluence에서 표를 만들고 형식을 지정하는 방법을 알아보세요.

더 효과적인 팀워크를 위한 팀 포스터

Confluence에서 팀 포스터를 만들어 협업을 촉진하는 방법을 알아보세요.