Close

Using Confluence whiteboards for embedded diagramming

Confluence whiteboards are where ideas come to life in an organized and polished way while maintaining the freeform, creative spirit of collaborative brainstorms.

With whiteboards, you can post ideas then connect and arrange them visually to form timelines, workflows, strategy and product breakdowns, and more. You can also create diagrams using shapes to represent different ideas and elements, then connect them with lines and arrows to show how they relate.

Diagrams are valuable tools for organizing work, aligning teams, and presenting plans and concepts clearly and efficiently to internal and external stakeholders. When used in combination with detailed plans, diagrams often let you paint the connected picture of the work you’re doing supported by rich context.

In this guide, find out how to create diagrams in whiteboards you can share on Confluence pages.


When, why, and how to incorporate diagrams in pages

Having whiteboards and pages both as content types within Confluence makes using them together a seamless experience. No more using different tools or disconnected systems that force you to recreate diagrams from scratch or copy and paste them from one place to another, risking all your previous formatting work.

Embedding a whiteboard with a diagram into a Confluence page means you always have the precise visual exactly where you want it. Even better, any changes made to the original diagram in the whiteboard will automatically update wherever else it’s shared. You can even customize what part of a whiteboard diagram you embed by linking to a section or individual object.

Here are some instances when leveraging whiteboard diagrams in pages is particularly useful:

Diagramming flows

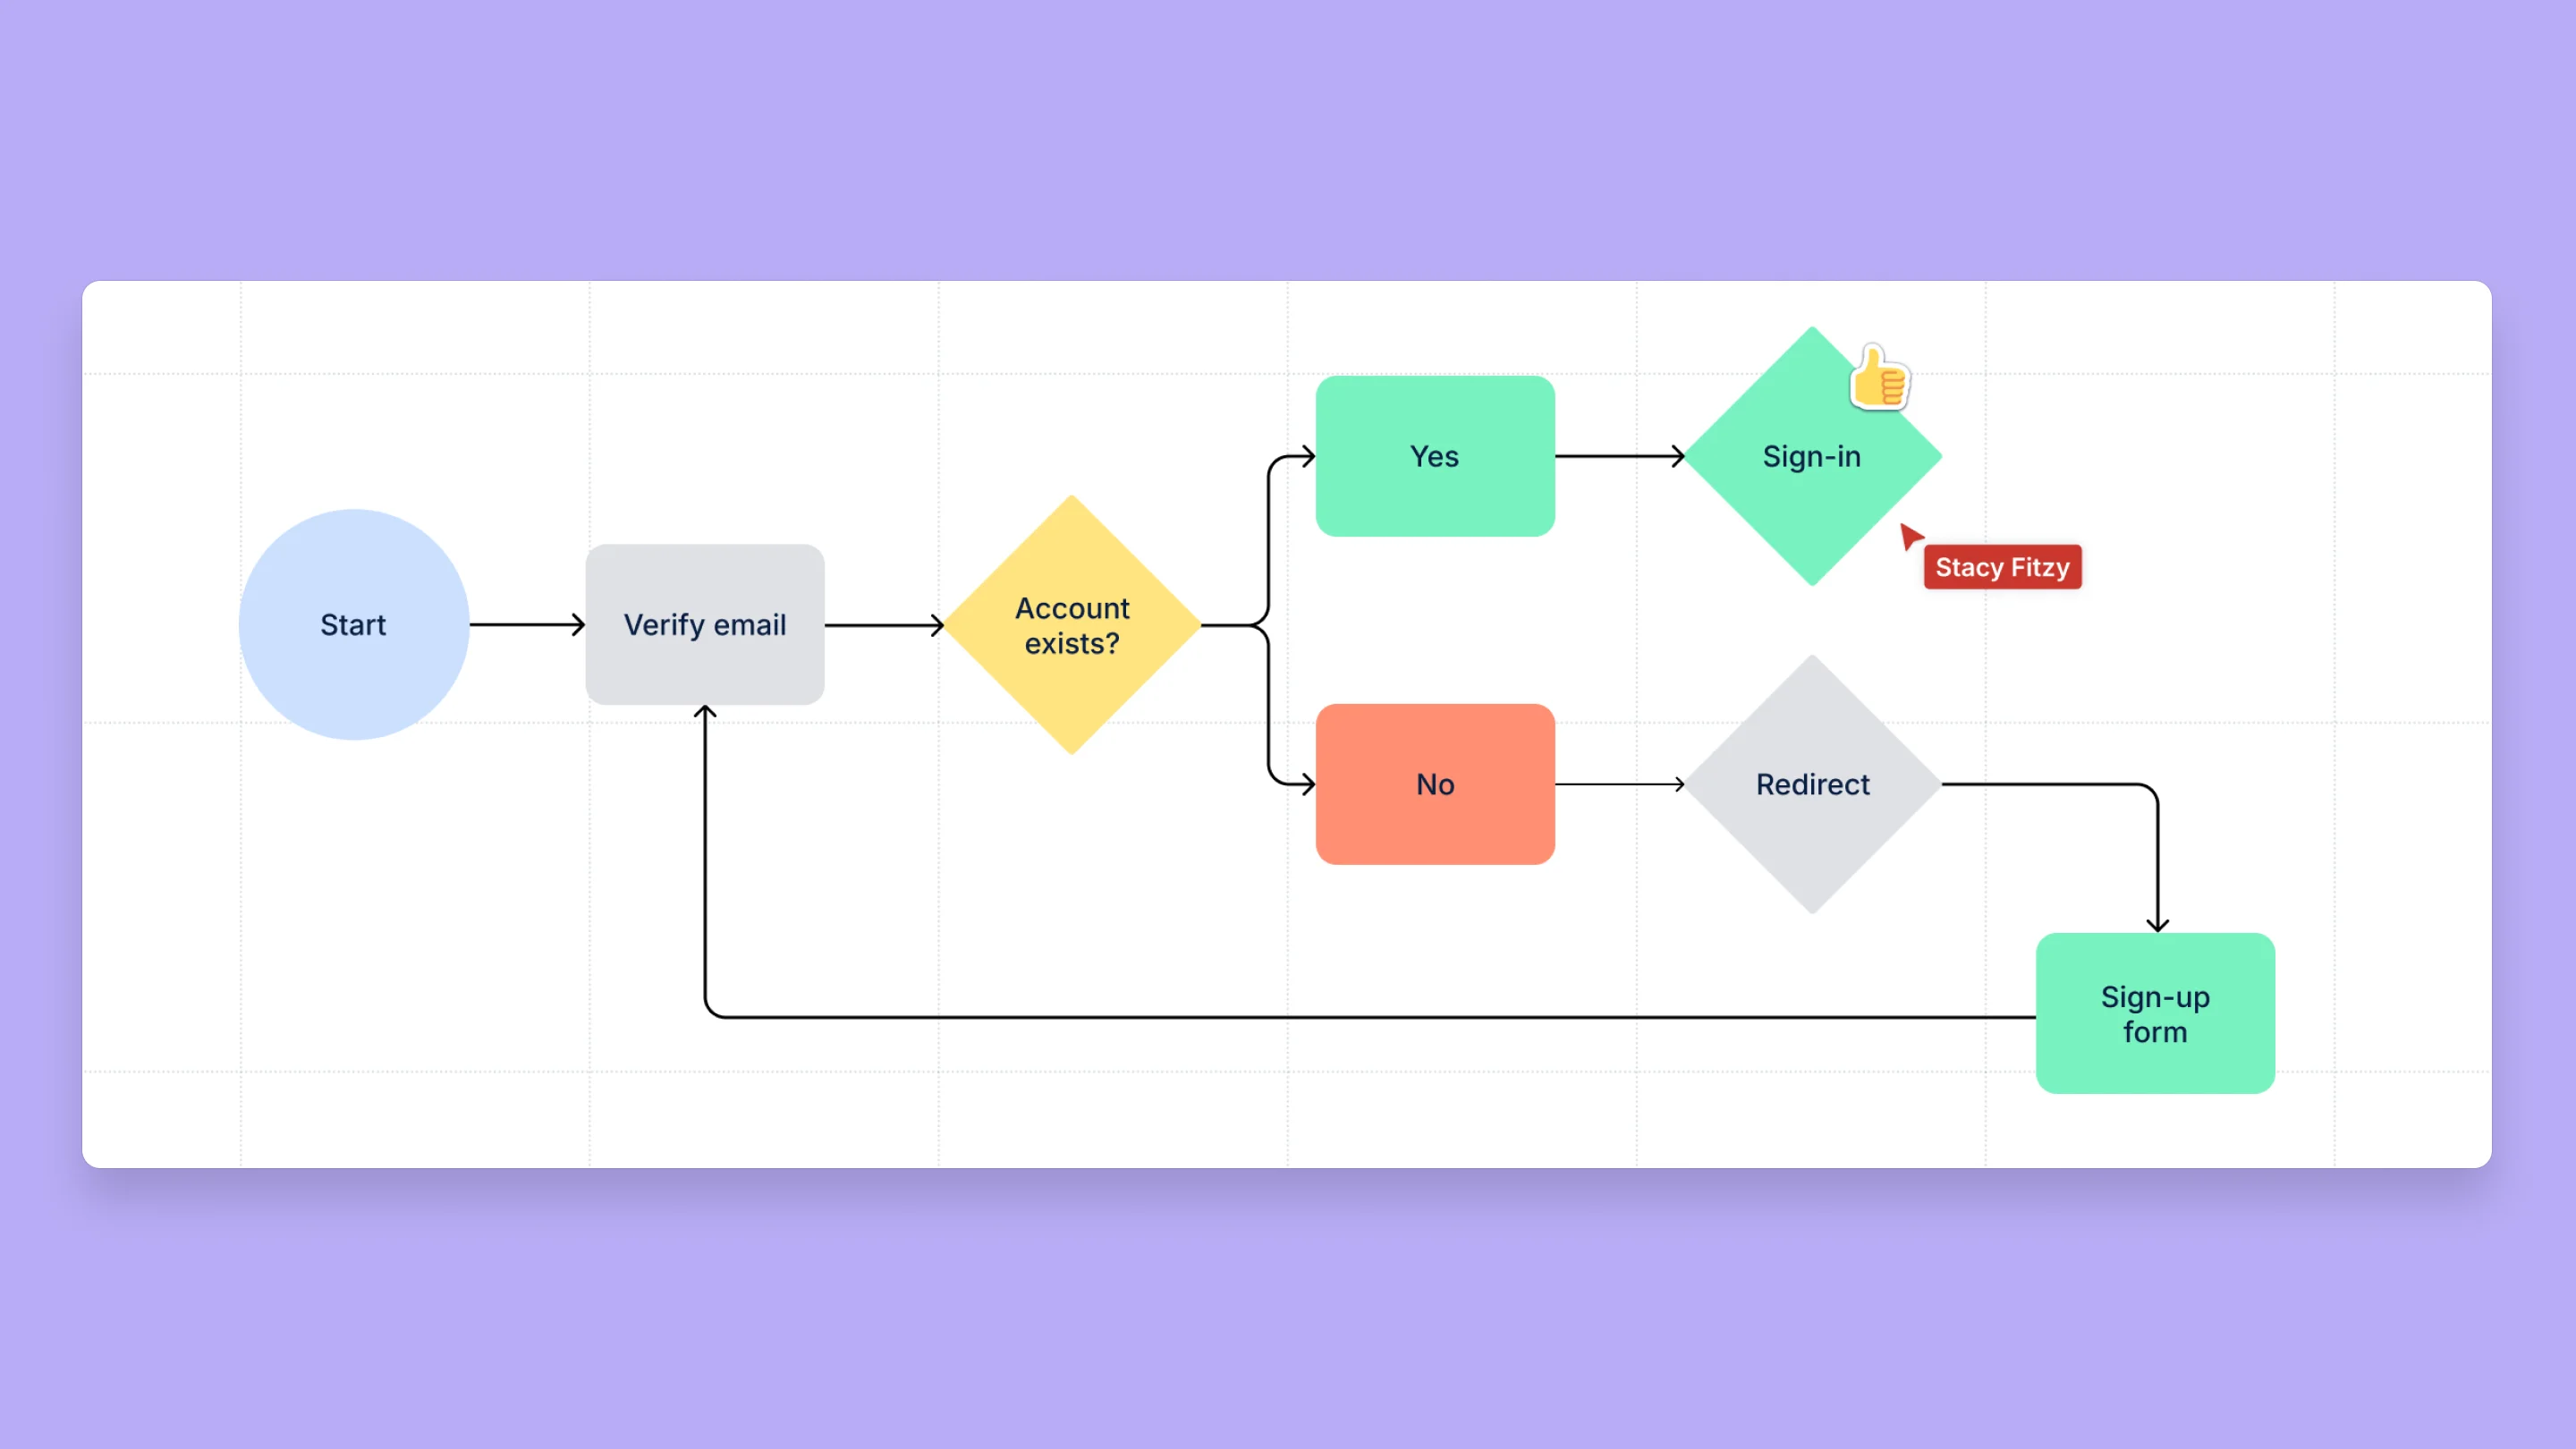
Whiteboard diagrams are great for building flowcharts. Flowcharts can visually represent a wide range of processes, workflows, and concepts. Diagramming these flows shows how they work and breaks down all the steps involved and how they’re connected.

屏幕截图

Once you diagram different flows in whiteboards, you can add them to relevant pages, for example:

  • Product development timelines in product roadmap documents
  • User engagement journeys in product development and audience research documents
  • Company-wide, departmental, and team decision making processes

Building project plans

Project management plans can be elaborate and complex with many moving parts. Diagrams help conceptualize and organize them into manageable, easily digestible pieces. Some examples of diagrams you can integrate into project planning documents include:

  • 项目时间线,概述了关键项目里程碑和产出的顺序和指定时限
  • 项目范围图,分解所有单独的要素及其负责人

制定营销策略

图表有助于表示受众研究、客户旅程、营销活动时间线等。下面是将图表纳入营销策略文档的一些示例:

  • 营销漏斗图,将不同的营销活动和举措与漏斗的每个阶段联系起来
  • 客户角色图,概述了目标受众的人口统计数据、行为、需求和痛点
  • 营销活动时间线图,将不同的任务分解成时间表
屏幕截图

页面中白板图表的主要功能和优势

知道如何链接白板并将其嵌入到 Confluence 页面中是成功将图表添加到协作工作流的关键。要将带有图表的整个 Confluence 白板嵌入到页面中,只需复制白板的 URL,然后根据您的需要将其作为链接粘贴到页面上的任意位置。Confluence 会自动将链接转换为白板的嵌入视图。

要将图表的特定部分嵌入到白板中,您需要复制版块或对象链接。从白板中,只需右键单击相应的版块、形状、线条或便笺,并选择“复制对象的链接”。然后,将该 URL 粘贴到白板嵌入的 Confluence 页面中,已经放大了您想要的版块或对象。

屏幕截图

改进协作

白板让参与项目的每个人都可以对图表做出贡献、更新图表并与之交互。多个团队成员可以实时编辑和扩展图表。您还可以向图表或图表的特定版块添加评论,以提出问题、进行澄清,并标记需要了解相关信息和问题的同事。

屏幕截图

同步更新

当您在页面中链接白板上的图表时,它将始终是最新的。对图表所做的任何编辑或更新都会在它嵌入的其他位置自动更新。

轻松创建和共享图表的不同变体

在构思复杂的想法或流程时,您通常需要创建图表的多个变体来表示随着时间的推移所处的不同状态。传统的图表绘制工具可能会保存副本或克隆原始图表。您稍后可能会意识到原始版本中缺少某些内容,在这种情况下,要在进行更改的同时试图让所有版本保持同步,这一过程令人沮丧。

借助白板,您可以在同一个宽阔的画布中创建和管理图表的多个版本。您可以缩小以概览所有图表,然后放大以处理特定版本。这种方法可让您并排显示不同的状态或变体,这使对其进行比较和完善变得更容易。您可以为每个版本复制单独的链接,这样便可以在文档中共享特定的图表,而不会产生混淆。

集中化且可扩展的图表来源

白板可让您为项目的所有图表维护一个集中化且可扩展的来源。在其他工具中,不同的图表可能来自多个文件,这会让管理和共享图表成为难题。白板提供了一个灵活的界面,可将项目的所有图表汇集在一个地方。

白板可让您的工作井井有条,并使其更容易扩展。随着项目的发展,您可以继续向同一个画布中添加内容,而不必担心空间不足或失去不同版本的踪迹。图表和其他白板内容可以随着项目相应地扩展。


将想法转化为可行的计划

通过将 Confluence 白板图表集成到 Confluence 页面中,您不仅可以增强和阐明它们,还能为项目创建动态变化的事实来源。能够实时更新图表、共享特定版块,并在一个平台上管理多个版本,这些功能可确保随着项目的发展,团队能够持续地保持一致。

有了 Confluence,您的图表不仅仅是静态图像,它们还是战略工具包的动态组件。立即试用白板,开始在 Confluence 中将您的图表推向新的高度

快速处理表格

了解如何在 Confluence 中创建表格和设置表格格式。

使用团队海报改善团队合作

了解如何在 Confluence 中创建团队海报以促进协作。