ガント チャートとは? 便利なテンプレートの主な特徴とメリット
ガント チャートは、プロジェクトのライフサイクル全体を通してタスクやマイルストーンを追跡するための視覚的なタイムラインを提供します。

無料のガント チャート テンプレートを開始する
プロジェクト効率を高めたいのであれば、このテンプレートを使用して、タイムライン、タスク、リソースを視覚的に計画、スケジュール、管理し、シームレスなコラボレーションを実現しましょう。
重要ポイント
ガント チャートは、効果的な計画と追跡のために、タスク、タイムライン、依存関係、マイルストーンをマッピングする視覚的なプロジェクト管理ツールです。
複雑なスケジューリングを簡素化し、リソース配分を強化し、すべての関係者に大まかな概要を提供できます。
コラボレーションと進捗の監視をサポートするために、主にタスク リスト、タイムライン、依存関係、マイルストーンで構成されています。
予定されているプロジェクトのガント チャートを作成することで、可視性と調整が向上し、期限内でのデリバリーが約束されます。
プロジェクト スケジュールの概要や、複数のチームや期限の変動を伴う複雑な計画を簡単に管理する方法をお探しですか?
カスタム ガント チャートを検討しましょう。
ガント チャートのビューにより、プロジェクト マネージャーとチームは、組織的かつ集中的にゴールの達成に集中できるようになり、サイロ化することはありません。カスタマイズ可能なガント チャートは、プロジェクト ライフ サイクルのタイムラインとしても機能します。
これにより、タスクやマイルストーンを追跡し、進捗を関係者と共有できるようになります。管理対象がスプリントか長期プロジェクトかを問わず、この包括的なガイドでは、ガント チャートとは何か、その実用的な用途、メリット、今すぐ始められる無料のテンプレートについて詳しくご説明します。
ガント チャートとは?
ガント チャートは、プロジェクト内のさまざまなタスクや活動の進捗状況を計画し、追跡するために使用されるアジャイル プロジェクト管理ツールです。視覚的なタイムラインとして機能し、タスクのリスト、開始日と終了日、マイルストーン、タスク間の依存関係、および担当者が表示されます。
貴重なロードマップであるガント チャートは、チームや組織が作業項目を効果的に計画し、調整するための指針となります。タスクの相互関係を示すことで、プロジェクト関係者間のシームレスなコラボレーションと調整を促進します。
明確に定義され、視覚的にわかりやすいガント チャートがあれば、全員が同じ認識を持ち、同じゴールに向かって取り組むことができます。
ガント チャートの歴史
ガント チャート フォーマットは、1910 年代初頭にこの視覚的なプロジェクト管理手法を開発した米国の機械エンジニアである Henry Gantt 氏に由来します。元々製造や建設プロジェクト向けに設計されたこのチャートは、紙に手描きされていたため、プロジェクトのタイムラインが変更されるたびに手作業で更新する必要がありました。
このシンプルでありながら効果的なツールは、数十年の間に大きく進化しました。静的な紙のチャートから始まったものが、動的なソフトウェアベースのソリューションへと変化しました。
最新のガント チャート作成ツールは、リアルタイムのコラボレーション、自動更新、他のプロジェクト管理ツールとの統合を提供するようになり、複雑なプロジェクトには不可欠なものとなっています。
ガント チャート ソフトウェアの主な機能
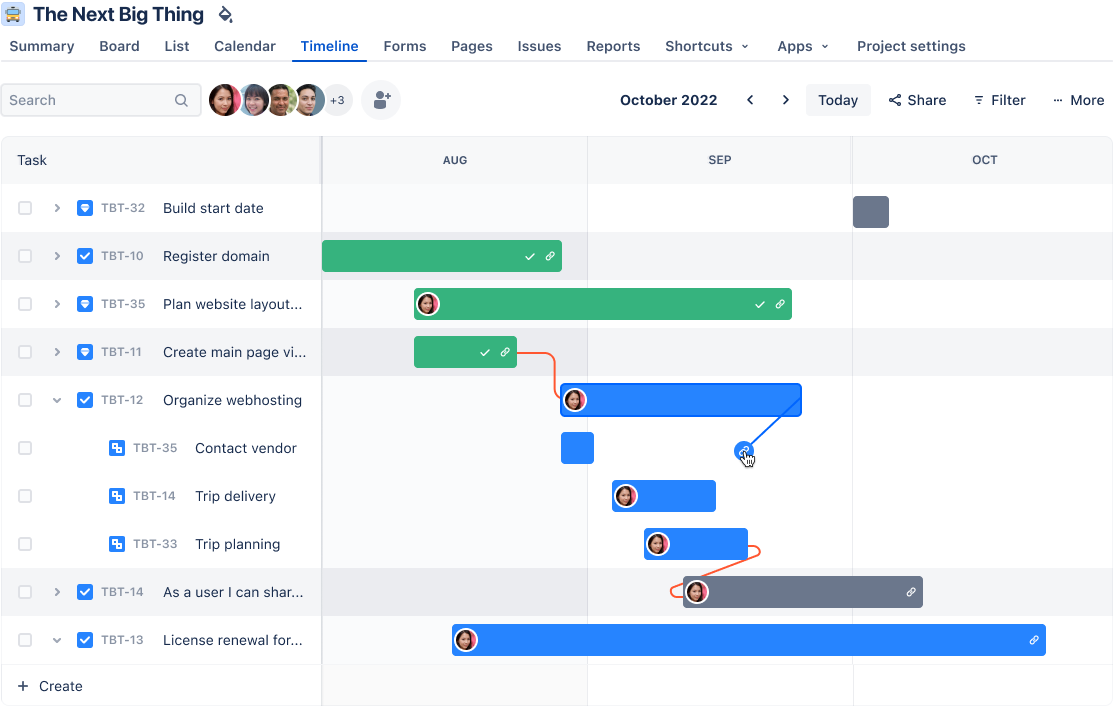
ガント チャートには通常、2 つのセクションがあります。左側にはタスクのリストの概要があり、右側には作業を視覚化したスケジュール バー付きのプロジェクト タイムラインがあります。ガント チャートの主なコンポーネントを詳しく見てみましょう。
タイムライン
タイムラインはプロジェクトのスケジュールを視覚的に表したもので、グラフの上部に開始日と終了日が表示されています。プロジェクトのスケジュールが明確になり、一連のタスクとその期間を視覚化できます。
タイムラインは、潜在的なボトルネックを特定し、プロジェクトを順調に進めるためのプロアクティブな調整を可能にします。たとえば、マーケティング チームはタイムラインを使って製品の発売を計画し、すべてのプロモーション活動が予定通りに調整され、実行されるようにします。
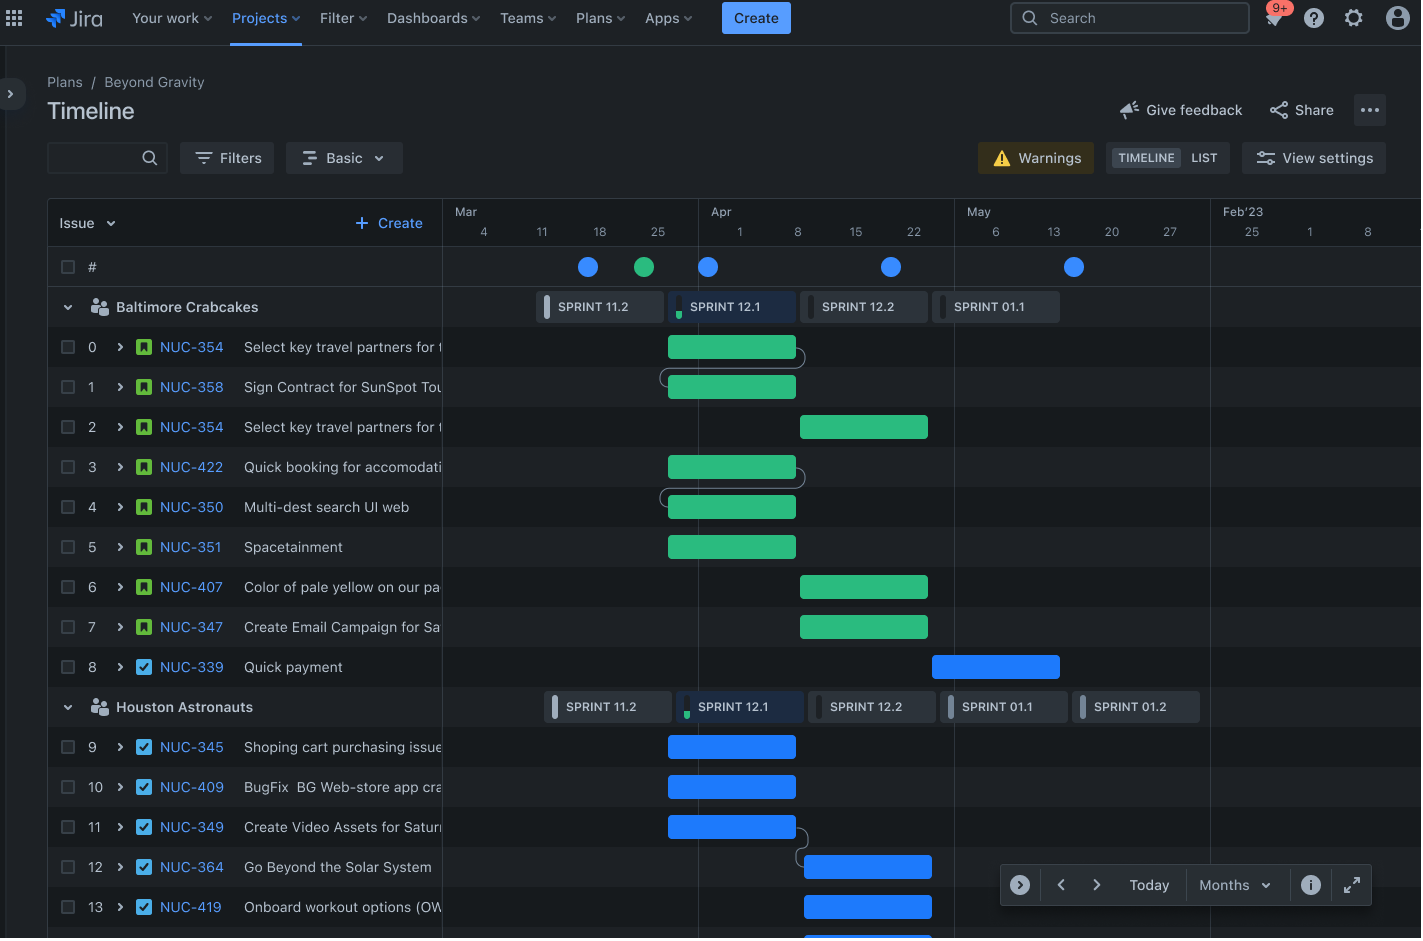
依存関係
タスク間のリンクは操作の順序を決定し、タスク間の関連性を示します。Advanced Roadmaps では、タスク間の依存関係を設定して、タスクが正しい順序で完了するようにします。
同時に、ロードマップでは変更が発生したときに自動的にスケジュールを調整する必要があります。これにより、前提条件タスクが完了してから依存タスクが開始されるため、遅延を防ぐことができます。たとえば、建設プロジェクトでは、建造物を建設する前に必ず基礎工事が完了していることを確認するなど、さまざまな依存関係があります。
リソースの割り当て

大規模なプロジェクトや作業の大部分を、「作業項目」と呼ばれる小さく管理しやすい単位に分割します。作業項目を使えば、タスク情報やステータス更新を把握でき、常にチーム全体に最新情報を提供できます。
効果的なリソース管理を行うことで、チーム メンバーに過剰な負担がかかるのを防ぎ、スキルに適切に合致したタスクを担当させることができます。
リスト
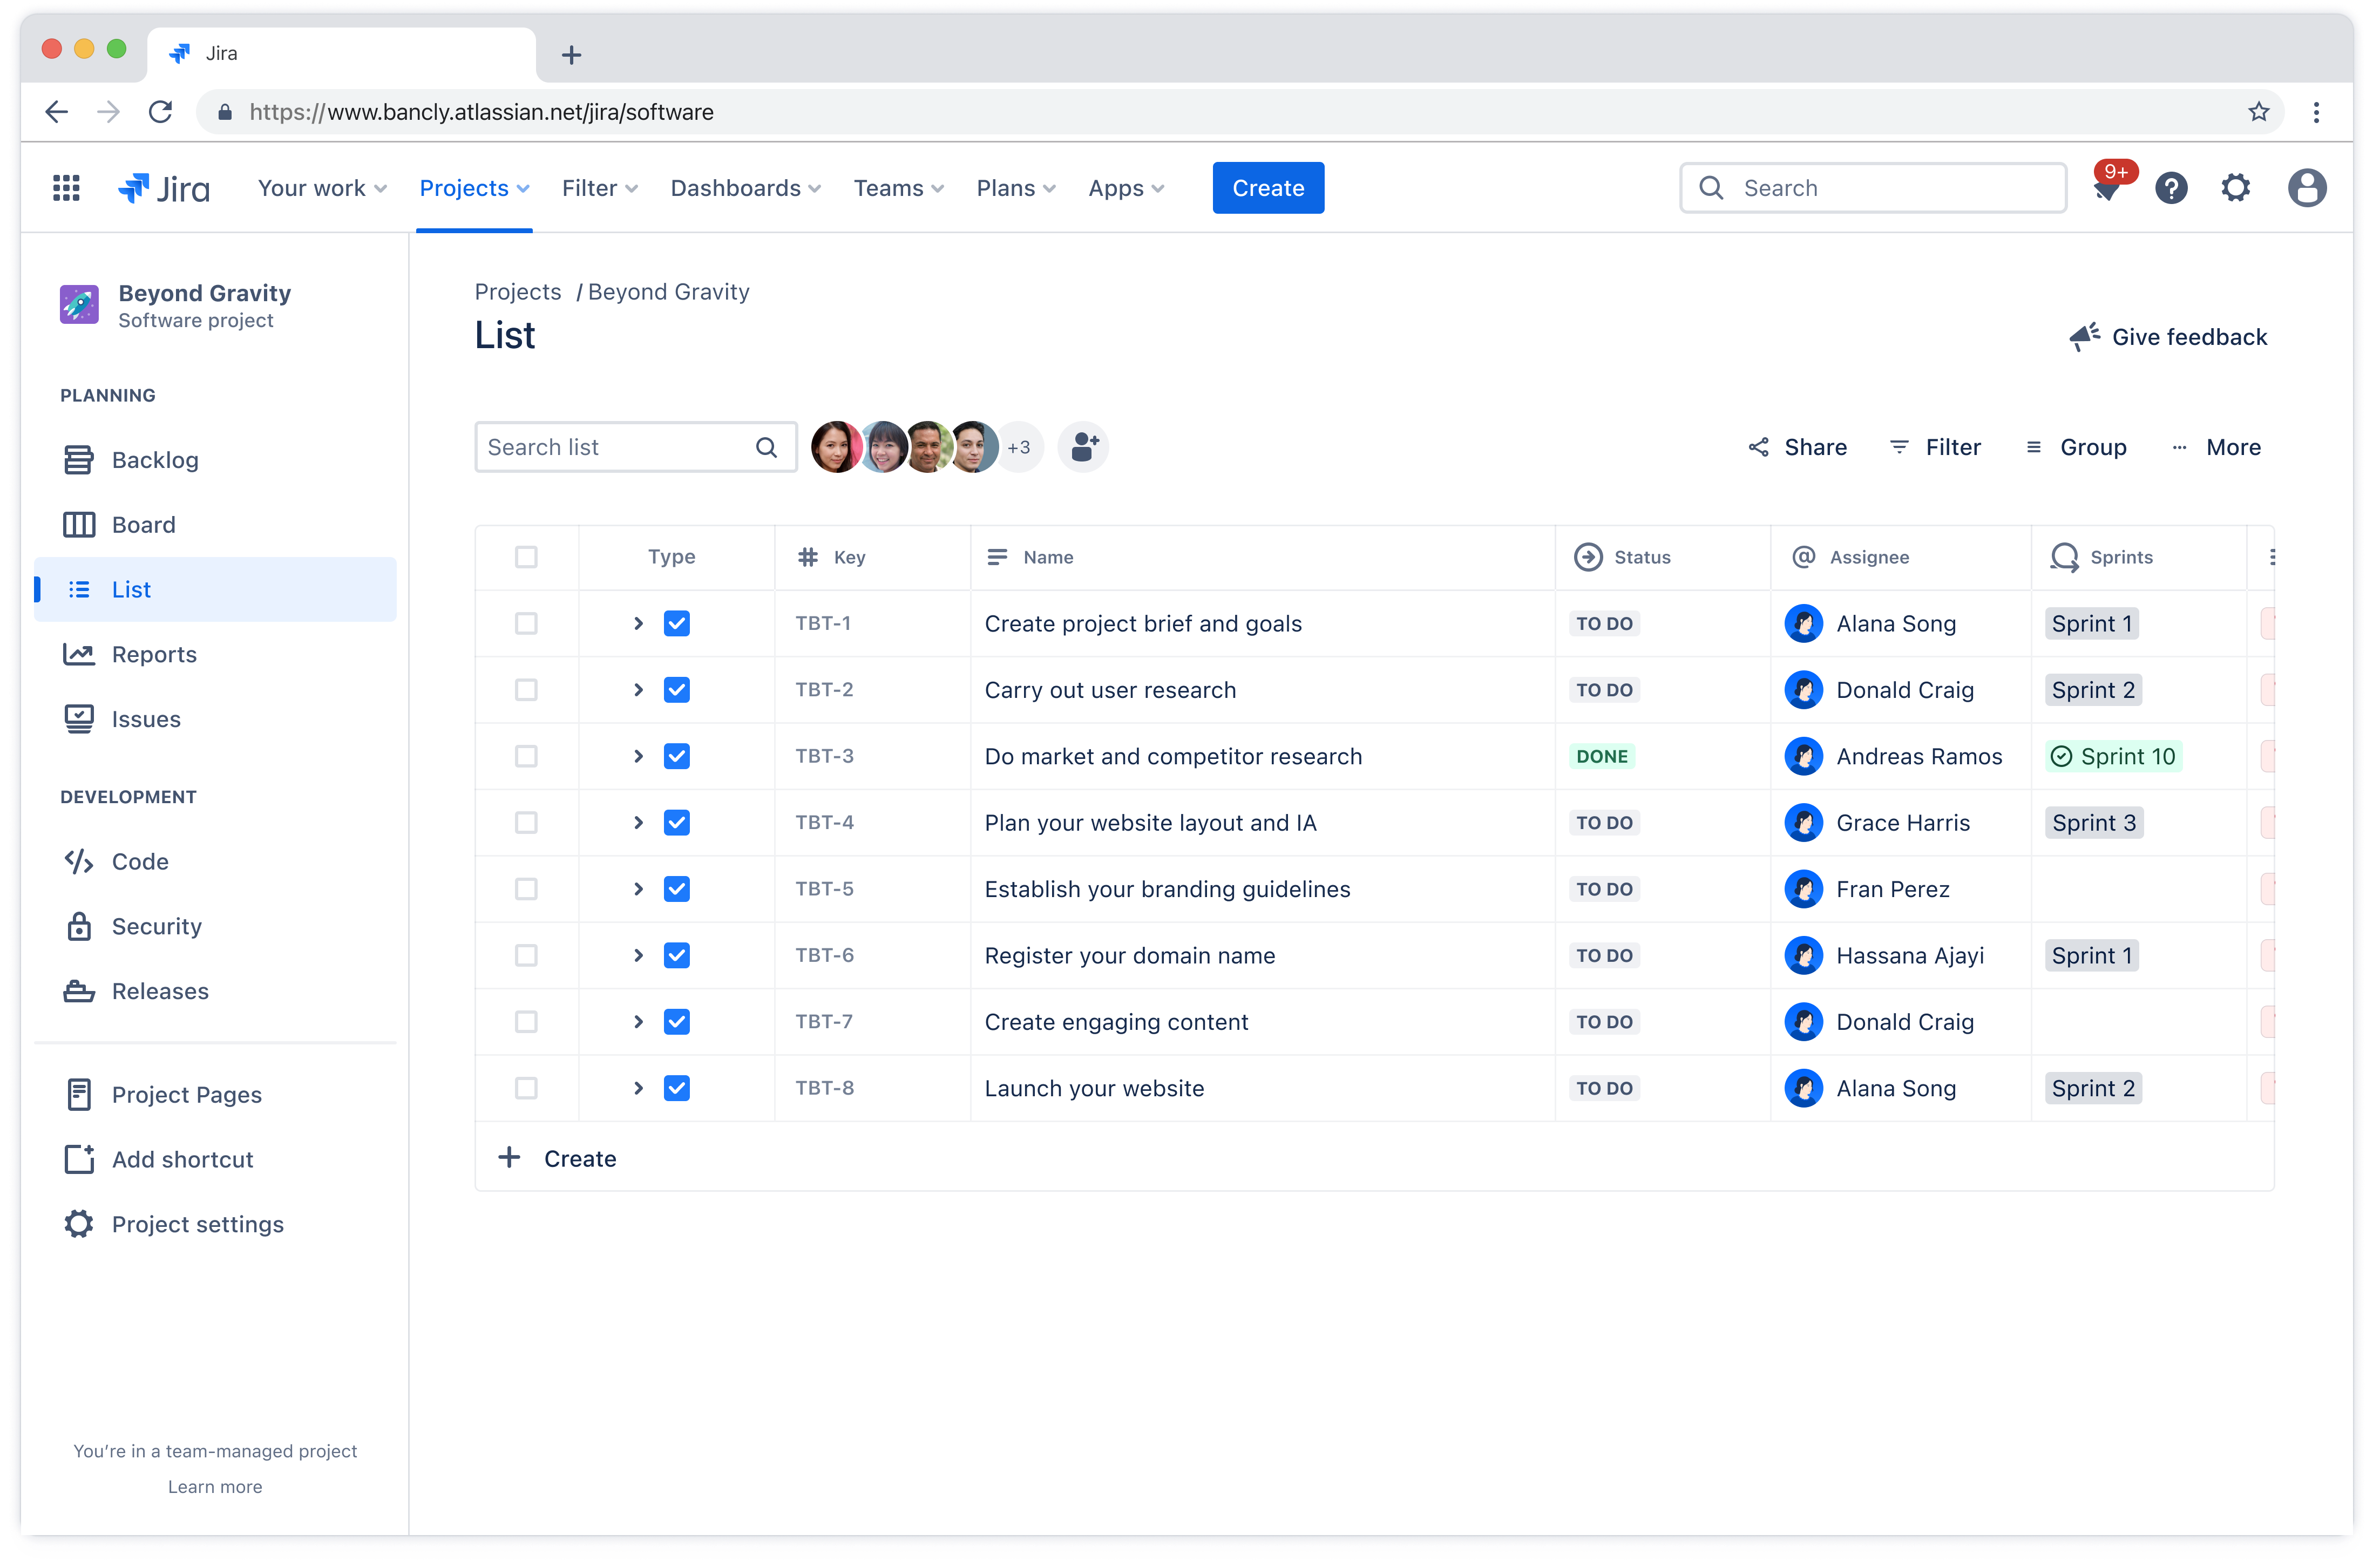
タスク リストは、プロジェクトを完了するために必要なすべてのタスクを網羅したリストです。プロジェクト管理ソフトウェアを使用すると、作業項目トラッカーによってタスクの作成や管理を行えます。
これにより、チーム メンバーにタスクを割り当て、優先順位を設定し、進捗を追跡できます。チーム メンバー全員が自分の責任と締め切りを把握できるようになり、説明責任と効率性が促進されます。
たとえば、ソフトウェア開発チームはタスク リストを使用して、コーディング、テスト、デプロイのタスクをさまざまな開発者に割り当て、スムーズなワークフローを実現します。
マイルストーン
ガント チャート上のプロジェクト マイルストーンは、プロジェクト フェーズの主要な進捗状況または完了を示すプロジェクト タイムライン上のマーカーです。適切なツールがあれば、マイルストーン マーカーを使用して重要なマイルストーンをマークできるため、チームは重要な締め切りや成果に集中できます。
マイルストーンはモチベーションと達成感をもたらすため、チームは長期的な目標に集中し続けることができます。たとえば、製品開発チームは、プロトタイプ段階の完了のマイルストーンを設定し、ユーザー テストの準備が整ったことを示すことができます。
ガント チャートを使用するメリットとデメリット
他のプロジェクト管理ツールと同様に、ガント チャートにもチームが検討すべき明確なメリットと制限があります。
ガント チャートの主なメリット
視覚的な明確さ: チームは、プロジェクトの進捗、今後の締め切り、タスクの関係性をひと目で即座に確認できます。
計画の強化: 視覚的に表すことで、潜在的な競合の特定と、それらを回避した計画の作成が容易になります。
コミュニケーションの向上: 関係者は、詳細なレポートを集中して読むことなく、プロジェクトのステータスをすばやく把握できます。
より適切な時間管理: タイムラインが明確であれば、チームは優先事項に集中して取り組むことができます。
ガント チャートの注意すべき制限
大規模プロジェクトの複雑さ: 何百ものタスクを管理する場合、ガント チャート テンプレートを扱いきれなくなる可能性があります。
メンテナンス要件: チャートの正確性と利便性を維持するには、定期的なアップデートが不可欠です。
学習曲線: 一部のチーム メンバーには、チャートを効果的に読み取ってアップデートするためのトレーニングが必要な場合があります。
ガント チャートを使用するタイミング (および使用しないタイミング)
ガント チャートは特定のシナリオでは優れていますが、すべてのプロジェクト タイプに対して常に最適な選択肢というわけではありません。
理想的なユースケースは次のとおりです。
タイムラインが重視される大規模プロジェクト: プロジェクトの実行に複数のフェーズと依存関係が含まれる場合。
部門横断型のイニシアチブ: 異なる部門またはチーム間の調整を必要とするプロジェクト。
クライアント対応が必要な業務: 関係者がプロジェクトの進捗や成果物を明確に把握する必要がある場合。
ガント チャートは強力な視覚化機能を提供しますが、よりシンプルなワークフローにとっては必要以上に複雑になる場合があります。次のような場合は、より簡素化された代替案を検討してください。
小規模で柔軟なプロジェクトの管理: アジャイル スプリントは、カンバン ボードからより多くのメリットを得られる可能性があります。
頻繁に変化する要件への対応: 静的チャートはすぐに時代遅れになる可能性があります。
主要なクリエイティブ プロジェクト: プロセスが直線的ではなくより探索的なプロジェクト。

誰がガント チャートを使用すべきか?
ガント チャートはプロジェクト マネージャーだけのものではなく、時間やチームをまたいで複雑な作業を調整する必要がある人に役立つツールです。ガント チャートのメリットを最も享受できる役割は次のとおりです。
プロジェクト マネージャー: プロジェクト マネージャーはガント チャートを使用して、複数のイニシアチブにわたって包括的に監視し、戦略的な計画を作成します。視覚的に表すことで、プロジェクト間の潜在的な競合を特定し、リソースを効果的に割り当て、関係者に進捗をひと目で伝えることができます。
チーム リーダー: チーム リーダーはガント チャートを使用して、特定の部署や機能領域内の作業を調整します。チーム メンバーがいつ対応できるかを正確に把握したり、潜在的なボトルネックを発生前に特定したり、成果物がより広範なプロジェクト タイムラインに沿っていることを確認したりできます。
運用マネージャー: 運用マネージャーはガント チャート フォーマットを使用して、定期的なプロセスを管理し、組織全体のリソース管理を最適化します。プロジェクトベースの作業とは違って、運用には周期的な活動が含まれることがよくあり、効率性を維持するために慎重に調整する必要があります。
業界によって用途が大きく異なることに注意してください。たとえば、建設チームは、取引の調整や資材配達の管理のためにガント チャートを広く活用しています。これにより、型枠が設置されてからコンクリートが打設され、骨組み工事が完了してから電気工事が開始されます。
一方、ソフトウェア開発チームは、ガント チャートをリリース計画や機能開発に応用しています。多くの場合、アジャイル手法と組み合わせて、より長期間にわたるスプリント計画を視覚化しています。
ガント チャートの作成方法
ガント チャートのメリットを念頭に置いて、プロジェクト計画を明確で実行可能なチャートに変換する方法を詳しく見ていきます。ガント チャートがプロジェクトを成功させるための貴重なツールになるように、作業のスコープの定義から進捗の追跡まで、重要なステップについて説明します。
始めるには 2 つの方法があります。以下の手順に従ってガント チャートをゼロから作成する方法、または、セットアップのガイドとなる事前構築済みのセクションとサンプルが含まれる無料のテンプレートを使用してすぐに作業を開始する方法です。
ステップ 1: プロジェクトのスコープを定義する
ガント チャートを作成する最初のステップは、プロジェクトのスコープを定義することです。まず、プロジェクトの主な目標を特定します。明確な目標がプロジェクトの指針となり、プロジェクトのライフサイクルを通じてすべてのタスクがこれらのゴールと確実に一致するようになります。
プロジェクト目標を定義したら、主な成果物の概要を記述します。これらは、プロジェクト全体を通して生み出す必要のある具体的な成果になります。Confluence には、プロジェクト管理プロセスの合理化を目的としたプロジェクト計画テンプレートが用意されています。
プロジェクトのスコープを定義し、明確なマイルストーンを設定して計画を立てるという最初のステップをサポートします。プロジェクト計画が策定されたら、マイルストーンや成果物ごとのタスクの作成にシームレスにトランジションできるため、構造化された効率的なワークフローを実現できます。
ステップ 2: すべてのタスクとサブタスクをリストする
次に、各成果物を完成させるために必要なすべてのタスクをリストにします。チームが何をすべきかを明確に示すために、大きなタスクを小さなサブタスクに分割します。各タスク、担当チーム メンバー、必要なリソースを特定します。
Jira の作業項目を使用することで、こうしたタスクをガント チャート構造内で効果的に作成/整理できます。各作業項目は、特定のタスクまたはサブタスクを表すため、チーム メンバーの割り当て、優先度の設定、進捗の追跡をプロジェクト タイムライン内で直接行えます。
使いこなしのヒント: Rovo を Jira や Confluence と統合することで、プロジェクト計画を Jira 内の詳細なタスクにシームレスに変換できるため、ワークフローが合理化され、生産性が向上します。Rovo がプロジェクト計画を実行可能な Jira チケットに変換する方法を今すぐご覧ください。
ステップ 3: タスク期間を見積もる
各タスクを完了するのに必要な時間を決定します。現実的に考えて、潜在的な遅延を考慮しましょう。予期しない遅延に対応しながらもプロジェクトを順調に進められるように、予定にバッファー時間を含めます。
ステップ 4: タスクの依存関係を特定する
タスクの順序を指定します。一部のタスクは、その他のタスクが完了したあとに開始できます。タスク間の関係を定義するには、終了 - 開始型、開始 - 開始型のような依存関係タイプを使います。
プラン機能と呼ばれる Jira の Advanced Roadmaps を使用すると、チームがタスクのつながりを視覚化して、変更が発生したときにタイムラインが自動で調整される、包括的なプロジェクト ロードマップを作成できます。これにより、プロジェクトが進展しても、ガントチャートが正確な状態に保たれます。
ステップ 5: ガント チャート ツールを選択する
ガント チャート ツールを選択する際には、いくつかの主要な要素を検討して、ツールがプロジェクトの特定のニーズを満たしているかどうかを確認します。
Jira は、特にソフトウェア チームやマーケティング チームにとって、ガント チャートを作成するための優れた選択肢です。タイムラインやプラン機能などのツールは、Advanced Roadmaps の作成に役立ちます。こうした機能により、詳細なタスク管理、依存関係の追跡、リソースの割り当てがサポートされます。ガント チャート テンプレートによってプロセスの合理化も行えます。
ステップ 6: データを入力する
Jira では、ガント チャートにデータを手動で入力する必要はありません。プロジェクト計画からタスクを作成したら、タイムライン ビューに簡単に切り替えたり、Jira の Advanced Roadmaps を利用してガント チャートのような視点で表示したりできます。
この機能は、タスク期間、依存関係、主要なマイルストーンを自動的に反映するため、プロジェクトのタイムラインは常に最新の状態に保たれ、正確に視覚化されます。
Jira のガント チャートを使用してプロジェクトを効率化する
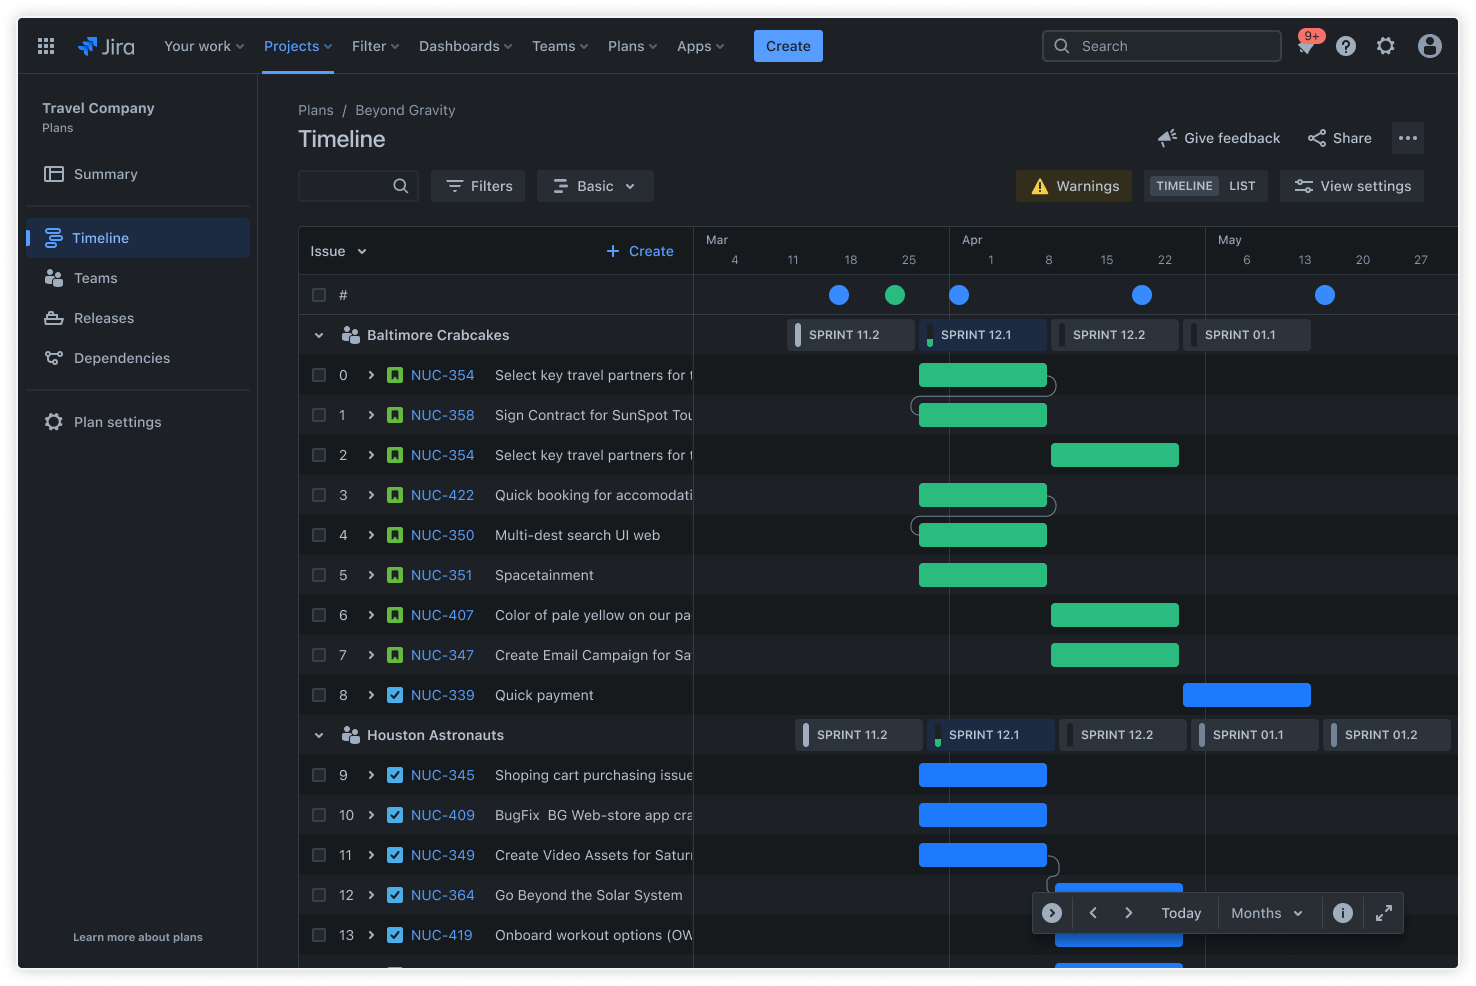
Jira は、強力なタイムラインの視覚化と堅牢な作業の追跡機能により、プロジェクトの計画と実行を強化します。Jira の動的なタイムライン機能は、タスク、日付、依存関係の変更を反映するようにチャートを自動的に更新するため、プロジェクト計画が常に最新の状態に保たれます。
Advanced Roadmaps を使用すると、ポートフォリオレベルのビューが得られ、複数のチームが関与する複雑なイニシアチブの管理に最適です。この機能は単なるタスクの順序付けにとどまらず、プロジェクトのタイムライン全体にわたる変更の影響を自動的に計算し、遅延によって影響を受けるタスクをハイライトします。
Confluence は、プロジェクト管理ワークフローとタイムラインの実装を強化することで Jira を補完します。Jira は実行と追跡に優れており、Confluence はプロジェクト ドキュメント、要件収集、関係者のコミュニケーションのための中心ハブとして機能します。
ライブの Jira タイムラインを Confluence ページに直接埋め込むことで、視覚的なスケジュールと詳細なプロジェクト コンテキスト、ミーティング議事録、ステータス レポートを組み合わせた包括的なプロジェクト ダッシュボードを作成できます。
Gantt Chart Frequently Asked Questions
What is the main purpose of a Gantt chart?
A Gantt chart is a visual timeline used to plan, schedule, and track tasks and milestones throughout a project's lifecycle. It helps teams coordinate work, manage dependencies, and communicate progress.
What are the 7 important elements of a Gantt chart?
Key elements of a Gantt chart include the timeline, task list, dependencies, resource allocation, milestones, progress tracking, and assignees. These components provide a comprehensive view of project status and responsibilities.
What are common mistakes when making a Gantt chart?
Common mistakes include overcomplicating the chart, failing to update it regularly, not accounting for dependencies, and underestimating task durations. These issues can lead to confusion and project delays.
What are the 5 steps to building a Gantt chart?
The five steps are: define the project scope, list all tasks and subtasks, estimate task durations, determine task dependencies, and choose a Gantt chart tool to visualize and manage the schedule.