Summary: A Gantt chart is a visual timeline for tracking tasks and milestones throughout a project's lifecycle. It offers a high-level overview of project schedules, making it easier to manage complex plans involving multiple teams and shifting deadlines. By providing clear visibility, Gantt charts empower project managers and teams to stay organized and focused on achieving their goals together.
Whether you're managing sprints or long-term projects, this comprehensive guide explores what Gantt charts are, their practical applications, and the many benefits they offer.
Cosa sono i diagrammi di Gantt?
A Gantt chart is an agile project management tool used to plan and track the progress of various tasks and activities within a project. Serving as a visual timeline, it displays the list of tasks, their start and end dates, milestones, dependencies between tasks, and assignees.
As a valuable roadmap, a Gantt chart guides teams and organizations in effectively planning and coordinating their work items. By illustrating task interconnections, it fosters seamless collaboration and alignment among project stakeholders, ensuring everyone is on the same page and working towards the same goal.
I vantaggi dell'utilizzo dei diagrammi di Gantt
I diagrammi di Gantt hanno due vantaggi principali.
Simplifies complex planning
Gantt charts make it easier to create complex plans, particularly those involving multiple teams and shifting deadlines. They also help teams schedule tasks around deadlines and allocate resources efficiently.
Enhances task scheduling and resource allocation
Project planners rely on Gantt charts for a high-level overview, showing key details like task start and end dates, milestones, and dependencies. Modern Gantt chart programs like Jira Timelines and Jira's Advanced Planning synthesize information and illustrate how choices impact deadlines.
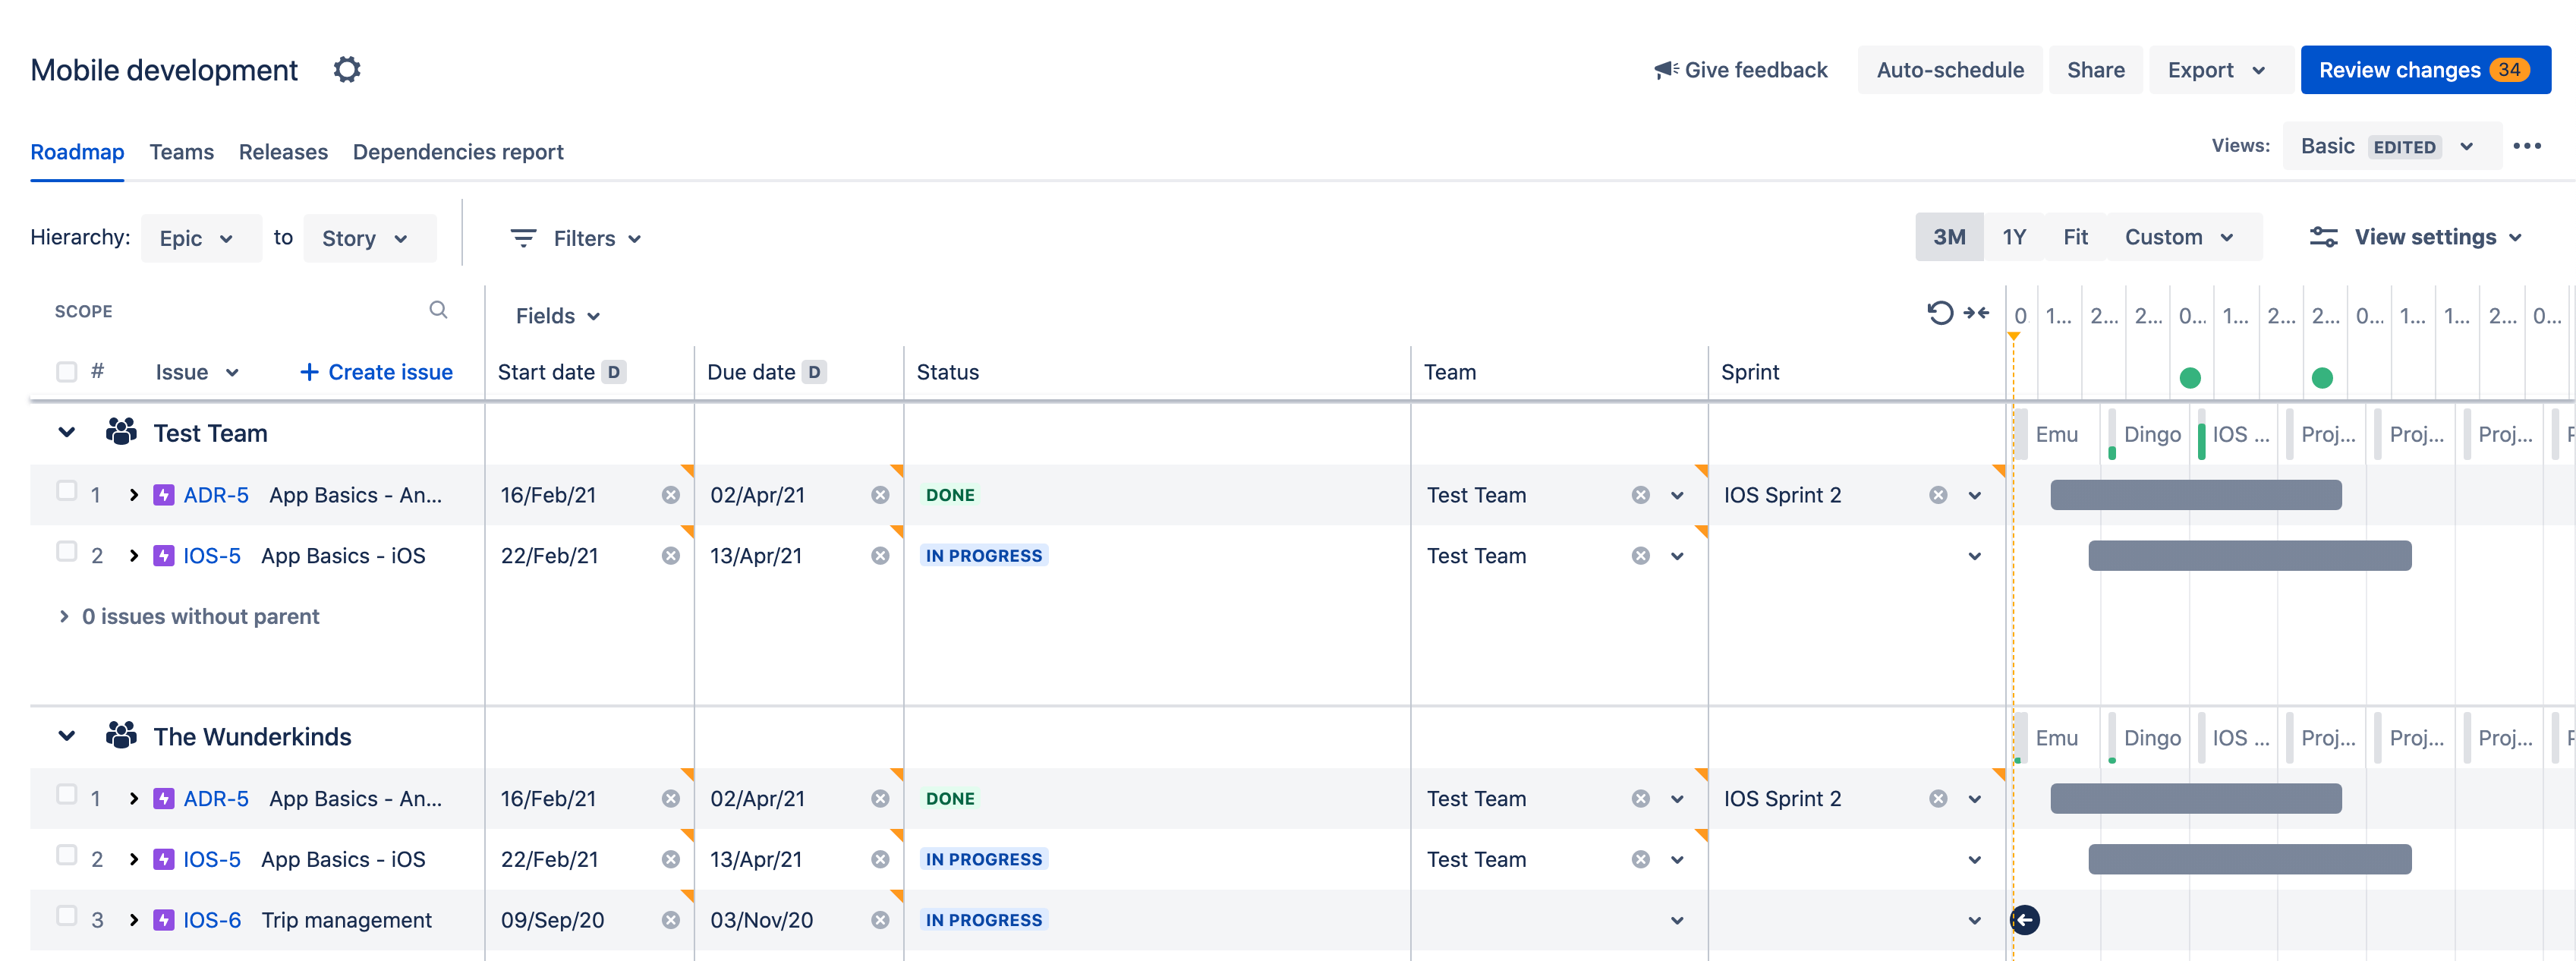
Gantt chart components
Gantt charts typically include two sections; the left side outlines a list of tasks, while the right side shows a project timeline with schedule bars that visualize work. Let's take a closer look at the primary components to look for in a Gantt chart.
Elenco dei task

A task list is a comprehensive list of all tasks required to complete the project. In Jira, tasks can be created and managed using the issue tracker, which allows you to assign tasks to team members, set priorities, and track progress. This ensures that every team member knows their responsibilities and deadlines, promoting accountability and efficiency. For example, a software development team uses the task list to assign coding, testing, and deployment tasks to different developers, ensuring a smooth workflow.
Timeline
The timeline is a visual representation of the project schedule, showing start and end dates at the top of the chart. Jira's Timeline feature provides a clear view of your project schedule, helping you visualize the sequence of tasks and their durations. Timelines help identify potential bottlenecks and allow for proactive adjustments to keep the project on track. For example, a marketing team uses the timeline to plan a product launch, ensuring all promotional activities are aligned and executed on time.
Dipendenze
Links between tasks dictate the order of operations and show how tasks are related. Jira's Advanced Roadmaps allows you to set dependencies between tasks, ensuring that tasks are completed in the correct order and automatically adjusting schedules when changes occur. This prevents delays by ensuring that prerequisite tasks are completed before dependent tasks begin. In a construction project, for example, dependencies ensure that foundation work is completed before building the structure.
Milestone
Project milestones on Gantt charts are markers on the project timeline indicating major progress or completion of project phases. In Jira, you can mark key milestones using milestone markers, which help keep your team focused on critical deadlines and achievements. Milestones provide motivation and a sense of accomplishment, helping teams stay focused on long-term goals. A product development team sets a milestone for completing the prototype phase, signaling readiness for user testing.
A cosa servono i diagrammi di Gantt?
I project manager utilizzano i diagrammi di Gantt per tre motivi principali.
Creare e gestire un progetto completo
I diagrammi di Gantt consentono di visualizzare gli elementi costitutivi di un progetto e lo organizzano in task più piccoli e gestibili. Questi task risultanti sono sulla timeline del diagramma di Gantt, insieme alle dipendenze tra task, assegnatari e milestone.
Determinare la logistica e le dipendenze tra i task
Usa i diagrammi di Gantt per monitorare la logistica di un progetto. Le dipendenze tra i task assicurano che un nuovo task possa essere avviato solo quando un altro task è terminato. I task ritardati comportano una riprogrammazione automatica. Questo può essere particolarmente utile nel caso della pianificazione in un ambiente che include più team.
Monitorare l'avanzamento di un progetto
Man mano che i team registrano il tempo necessario per risolvere i ticket inseriti nella pianificazione, puoi monitorare lo stato dei progetti e modificarli secondo necessità. Il diagramma di Gantt può includere date di rilascio, milestone o altre metriche importanti per monitorare l'avanzamento del progetto.
Come creare un diagramma di Gantt
Considerando i vantaggi dei diagrammi di Gantt, esploriamo come tradurre i programmi del progetto in un diagramma chiaro e attuabile. Tratteremo i passaggi essenziali, dalla definizione dell'ambito del progetto al monitoraggio dell'avanzamento, per garantire che il tuo diagramma di Gantt diventi uno strumento prezioso per la buona esecuzione del progetto.
Step 1: Define the project scope
Il primo passo per creare un diagramma di Gantt consiste nella definizione dell'ambito del progetto. Inizia identificando gli obiettivi principali del progetto. Degli obiettivi chiari guideranno il progetto e assicureranno che tutti i task siano in linea con tali obiettivi attraverso l'intero ciclo di vita del progetto.
Una volta definiti i tuoi obiettivi, delinea le deliverable chiave. Queste rappresentano i risultati tangibili che devi produrre durante l'intero progetto.
Step 2: List all tasks and subtasks
Quindi, elenca tutti i task necessari per completare ciascuna deliverable. Suddividi i grandi task in sottotask più piccoli per mostrare chiaramente cosa deve fare il tuo team. Identifica ogni task, il membro del team responsabile e le risorse necessarie.
Step 3: Estimate task duration
Determina quanto tempo richiederà il completamento di ogni task. Adotta un approccio realistico e considera eventuali ritardi. Includi del tempo di riserva nella tua programmazione per far fronte a ritardi imprevisti e assicurarti che il progetto rimanga in linea con le tempistiche.
Step 4: Determine task dependencies
Identifica la sequenza dei task. Alcuni task possono iniziare solo quando altri sono terminati. Usa i tipi di dipendenze, come finish-to-start o start-to-start, per definire le relazioni tra i task.
Step 5: Choose a Gantt chart tool
Quando scegli uno strumento per il diagramma di Gantt, valuta diversi fattori per assicurarti che lo strumento soddisfi le esigenze del tuo progetto.
Jira is an excellent option for creating Gantt charts, particularly for software development teams. Tools such as Timelines and Plans help you create advanced roadmaps. These features support detailed task management, dependency tracking, and resource allocation. You can even use a Gantt chart template to streamline the process.
Step 6: Input data
Quando hai tutte le informazioni, inserisci i dati nello strumento che hai scelto. Inserisci tutti i task e la loro durata nel diagramma di Gantt. Imposta le dipendenze tra i task per garantire che la sequenza sia chiara. Includi le milestone fondamentali per evidenziare i punti salienti nella timeline del progetto.
Best practice per creare diagrammi di Gantt efficaci
La creazione di un diagramma di Gantt efficace implica molto più del semplice inserimento dati. Ecco alcune best practice da seguire.
- Mantieni la semplicità e la chiarezza. Evita di ingombrare il tuo diagramma di Gantt con troppe informazioni. Usa colori ed etichette con parsimonia e includi solo i task e le dipendenze essenziali.
- Usa la codifica a colori. La codifica a colori aiuta a visualizzare meglio i diversi tipi di task o le relative fasi. Migliora la Visualizzazione timeline e semplifica il monitoraggio dell'avanzamento a colpo d'occhio.
- Comunica in modo chiaro. Assicurati che tutti i membri del team comprendano il diagramma di Gantt utilizzando descrizioni chiare dei task, indicatori delle milestone e tipi di dipendenza. Questo aiuterà a evitare confusione e a prevenire errori.
- Condividi il diagramma con i membri del team e gli stakeholder. Condividi il tuo diagramma di Gantt con tutte le parti interessate per garantire l'allineamento tra i team. Tieni tutti aggiornati su eventuali modifiche o revisioni al diagramma di Gantt.
- Aggiorna il diagramma regolarmente. Un diagramma di Gantt dovrebbe essere un documento attivo e regolarmente aggiornato durante tutto l'arco del progetto. Apporta le modifiche pertinenti per mantenere accurata la timeline con tutti i task completati o posticipati.
-
Incorporare i feedback. Chiedi regolarmente feedback al tuo team e incorporali nel diagramma di Gantt per migliorare la precisione e l'efficacia.
How different stakeholders utilize Gantt charts
Gantt charts are versatile tools that cater to the diverse needs of various stakeholders within a project team. Here's how different roles utilize Gantt charts, the components they focus on, the questions they aim to answer, and the common challenges they face:
Project manager
Project managers use Gantt charts to oversee the entire project timeline, manage resources, and ensure deadlines are met.
Key questions: "Are we on track to meet our deadlines?" "What resources are needed at each phase?" "How do task dependencies affect the project timeline?"
Common challenges: As a project manager, juggling complex dependencies and resource allocation can be tricky. Jira's Advanced Roadmaps feature helps by automatically adjusting schedules when dependencies change and providing a clear view of resource allocation.
Membri del team
Team members focus on their specific tasks and dependencies to understand their role in the larger project. They interact most with the task list and timeline components to track their responsibilities and deadlines.
Key questions: "What tasks am I responsible for?" "What are the deadlines for my tasks?" "How do my tasks fit into the overall project?"
Common challenges: Managing tasks and tracking changes and dependencies can be constantly shifting. Jira's real-time collaboration and issue tracker features ensure team members are always updated on task changes or dependencies shifts.
Stakeholder
Stakeholders view high-level progress and milestones to stay informed about the project's status. They focus on milestones and visual aids to grasp the project's progress quickly.
Key questions: "What is the current status of the project?" "Have we reached key milestones?" "Are there any major risks or delays?"
Common challenges: When trying to understand complex project details, stakeholders can feel easily overwhelmed by information. Jira's customizable views and milestone markers provide stakeholders with a clear, high-level overview of the project, ensuring they are informed without being overwhelmed.
By leveraging Jira's robust features, each stakeholder can effectively use Gantt charts to meet their specific needs, ensuring a cohesive and well-managed project.
Key features of Gantt chart software
Gantt chart software, like Jira, offers advanced features to enhance project management efficiency and effectiveness. Here's why these features are essential:
Automatic scheduling
This feature automatically adjusts timelines when task dependencies change, ensuring your project plan remains accurate and up-to-date. It saves time and reduces the risk of human error, allowing project managers to focus on strategic planning rather than manual updates.
Gestione delle risorse
Efficient resource allocation is crucial for project success. Effective resource management features help distribute tasks and resources across teams, optimizing workload and preventing burnout. This ensures that all team members are utilized effectively, contributing to a balanced and productive work environment.
Collaborazione in tempo reale
With real-time collaboration, team members can update progress and communicate changes instantly. This feature fosters transparency and keeps everyone aligned, reducing miscommunication and enhancing team cohesion. It is particularly beneficial for remote teams or projects with tight deadlines.
Customizable views
Different projects require different perspectives. Jira offers customizable views, such as daily, weekly, or monthly timelines, to suit various planning needs. This flexibility allows project managers to tailor their Gantt charts to specific project requirements, improving clarity and focus.
Integrations and compatibility
Gantt chart tools are most effective when they integrate seamlessly with other project management software and platforms. Jira excels in this area by offering robust integrations with tools like Trello and BigPicture. These integrations enable smooth project management across different systems, enhancing collaboration and efficiency.
By incorporating these features and integrations, Jira is a comprehensive solution for modern project management needs.
Come usare i diagrammi di Gantt in Jira
Jira dispone di due funzioni di creazione delle roadmap, ognuna con un focus leggermente diverso. Timeline di Jira tiene traccia del lavoro assegnato a un singolo team, mentre Programmi è specializzato nella pianificazione di progetti più ampi e interaziendali.
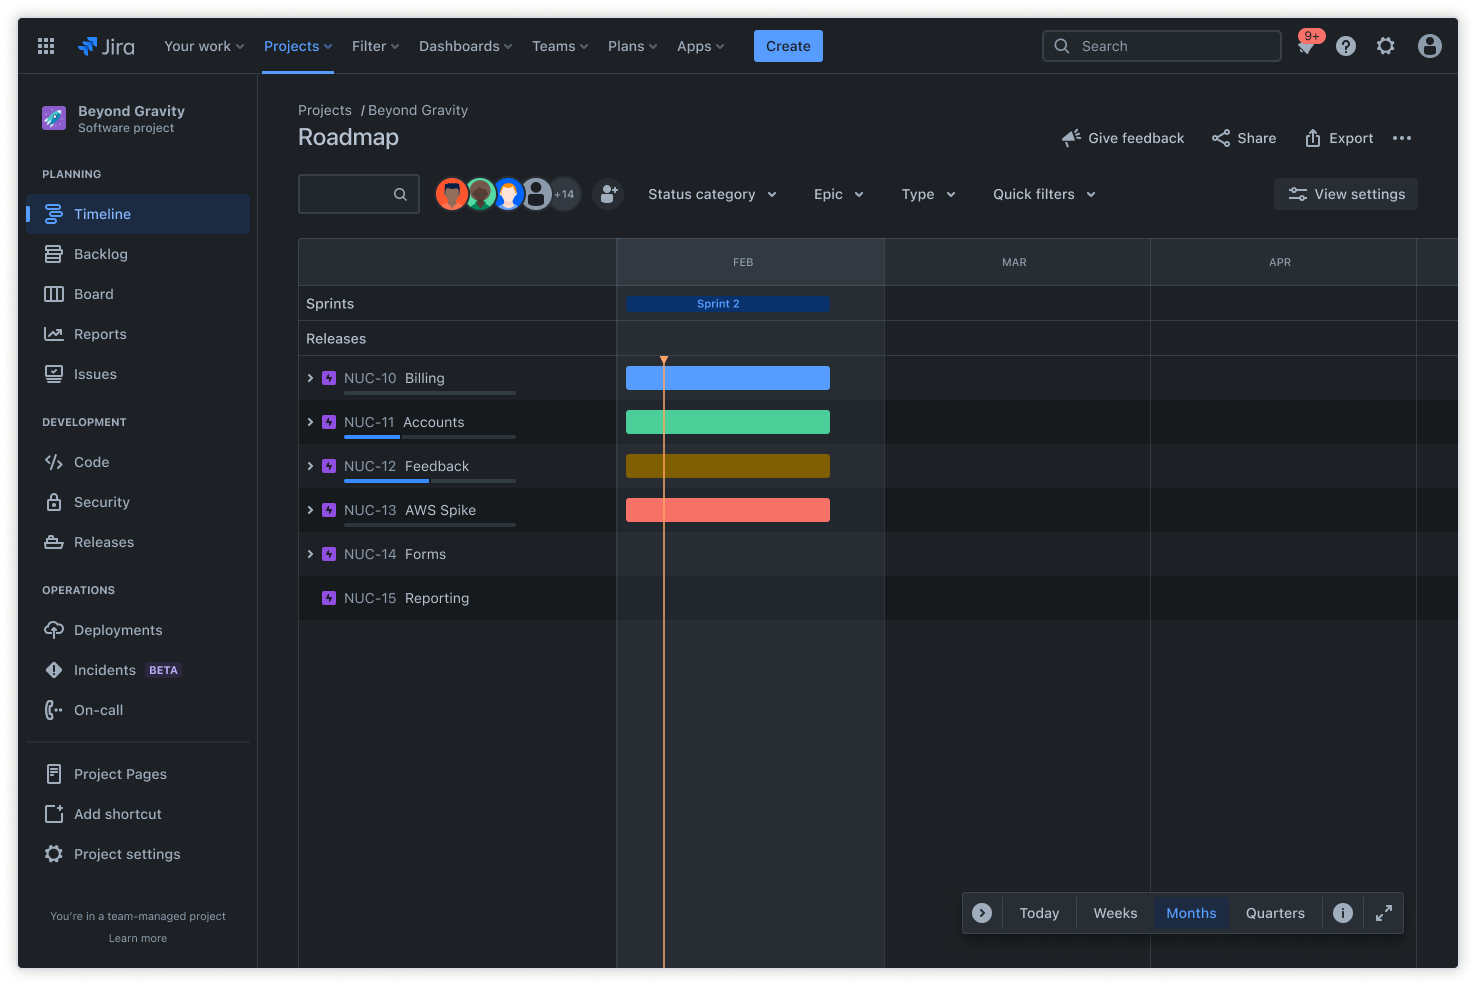
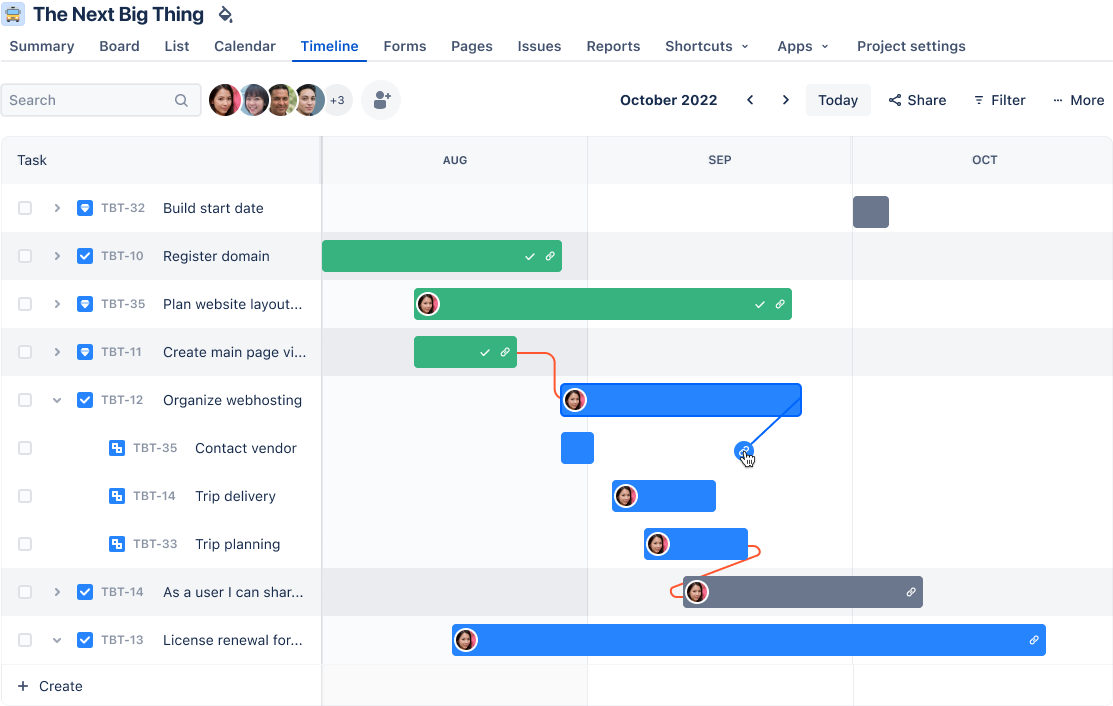
Diagrammi specifici del progetto: Timeline di Jira
Lo screenshot qui sotto, preso da Timeline, mostra un diagramma di Gantt specifico del progetto, comunemente utilizzato a livello di team o all'interno di un singolo gruppo. Il diagramma mostra come il team monitora i propri obiettivi. La struttura di suddivisione del lavoro comprimibile consente ai project manager di avere una visione d'insieme delle story cruciali del progetto. Jira offre un modello di gestione dei progetti gratuito che include diagrammi di Gantt.

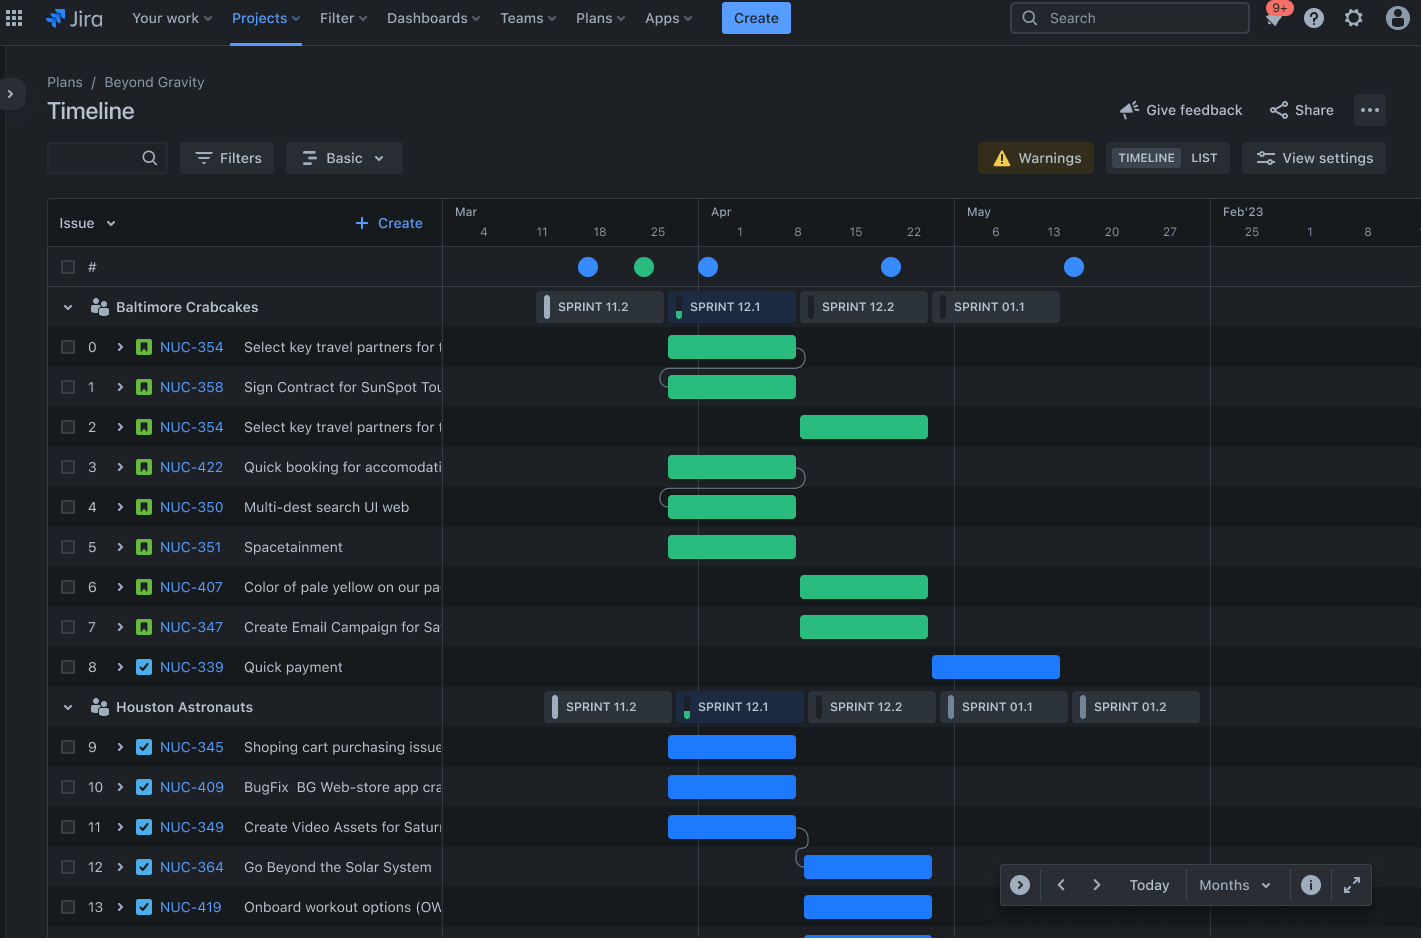
Organigramma generale: Programmi
Programmi di Jira offre una pianificazione facile e veloce che aiuta i team a gestire meglio le dipendenze e a monitorare l'avanzamento generale in tempo reale. Queste roadmap a livello di progetto o di team sono utili per la pianificazione a livello di team di grosse porzioni di lavoro.
Per la pianificazione, la gestione e il monitoraggio del lavoro su più team o persino sull'intera organizzazione, Programmi potenzia i team su larga scala.
I programmi progettati con flussi di lavoro che coinvolgono più team offrono strumenti più avanzati, come le funzioni di gestione della capacità e di programmazione automatica per aiutare a creare piani più complessi. Offrono inoltre una varietà di impostazioni di visualizzazione per consentirti di personalizzare il diagramma di Gantt ed evidenziare un certo aspetto del piano durante la presentazione.
Elevate your project management with Jira's Gantt charts
Transform your project management approach with the power of Gantt charts in Jira. These visual timelines are not just about tracking tasks—they're about achieving your project goals precisely and clearly. By leveraging Jira's robust features, you can create Gantt charts that are efficient and pivotal in steering your projects toward success.
Jira seamlessly integrates with various Gantt chart tools, providing a holistic project tracking and management solution. This integration ensures that your project timelines are always up-to-date, allowing real-time adjustments and insights.
Harness the full potential of Jira's capabilities to manage your Gantt charts effectively. With real-time updates, customizable dashboards, and advanced reporting, Jira empowers you to keep your projects on track and your team aligned.
Are you ready to revolutionize your project management strategy?
Risorse correlate
- Risorse per la gestione dei progetti
- Risorse per la pianificazione dei progetti
- Risorse per il lancio del prodotto
- Strategie di accesso al mercato per la gestione dei progetti
- Risorse per la gestione delle risorse
- Risorse per il monitoraggio dei task
- Risorse per la gestione dei progetti di marketing
- Risorse per la gestione dei programmi
- Risorse per i project manager
- Gestione dei progetti software