Czym jest wykres Gantta? Kluczowe funkcje i zalety wraz z pomocnymi szablonami
Wykres Gantta to wizualna oś czasu do śledzenia zadań i kamieni milowych w całym cyklu życia projektu.

Zacznij korzystać z bezpłatnego szablonu wykresu Gantta
Chcesz zwiększyć efektywność projektów? Użyj tego szablonu, aby wizualnie planować osi czasu, zadania i zasoby oraz zarządzać nimi w celu usprawnienia współpracy.
Kluczowe wnioski
Wykres Gantta to wizualne narzędzie do zarządzania projektami, które mapuje zadania, osie czasu, zależności i kamienie milowe w celu skutecznego planowania i śledzenia.
Upraszcza złożone planowanie, poprawia przydzielanie zasobów i zapewnia ogólny przegląd wszystkich interesariuszy.
Kluczowe komponenty obejmują listy zadań, osie czasu, zależności i kamienie milowe, wspierając współpracę i monitorowanie postępów.
Utwórz wykres Gantta dla następnego projektu, aby zwiększyć widoczność, koordynację i zapewnić terminową realizację.
Chcesz uzyskać przegląd harmonogramów projektów na wysokim poziomie lub ułatwić zarządzanie złożonymi planami z udziałem wielu zespołów przy zmieniających się terminach?
Czas rozważyć opracowanie niestandardowego wykresu Gantta.
Dzięki temu podejściu menedżerowie projektów i zespoły mogą zachować porządek i skupić się na wspólnym osiąganiu celów, zamiast pracować w izolacji. Konfigurowalny wykres Gantta sprawdza się również jako oś czasu w cyklu życia projektu.
Umożliwia śledzenie zadań i kamieni milowych oraz dzielenie się postępami z interesariuszami. Niezależnie od tego, czy zarządzasz sprintami, czy długoterminowymi projektami, ten kompleksowy przewodnik wyjaśnia, czym są wykresy Gantta, przedstawia ich praktyczne zastosowania i zalety oraz zawiera bezpłatny szablon, dzięki któremu możesz zacząć pracę już teraz.
Czym jest wykres Gantta?
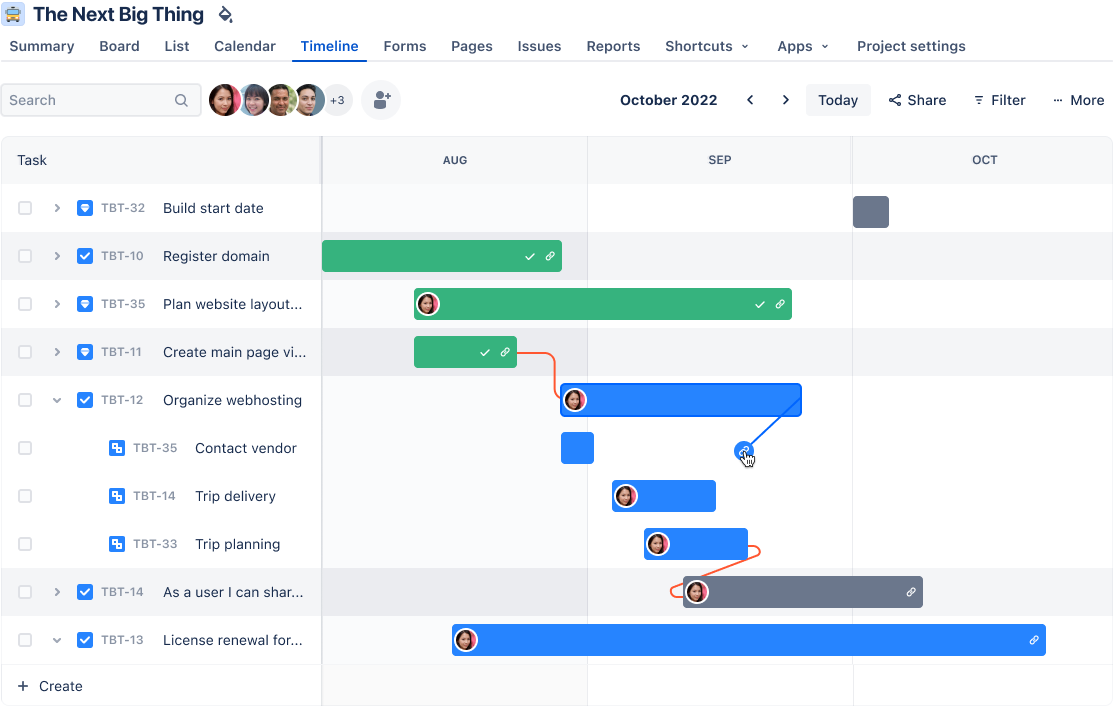
Wykres Gantta jest zwinnym narzędziem do zarządzania projektami służącym do planowania i śledzenia postępów różnych zadań i aktywności w ramach projektu. Działa jak wizualna oś czasu przedstawiająca listę zadań do wykonania, ich daty rozpoczęcia i zakończenia, kamienie milowe, zależności między zadaniami oraz osoby przypisane.
Wykres Gantta to bezcenne narzędzie, które pomaga zespołom i organizacjom w efektywnym planowaniu i koordynowaniu zgłoszeń. Dzięki zobrazowaniu wzajemnych powiązań między zadaniami sprzyja płynnej współpracy i koordynacji działań interesariuszy projektu.
Dobrze zdefiniowany i wizualnie przejrzysty wykres Gantta daje pewność, że wszyscy są na bieżąco i pracują nad tym samym celem.
Historia wykresów Gantta
Format wykresu Gantta zawdzięcza swoje powstanie Henry'emu Ganttowi, amerykańskiemu inżynierowi mechanikowi, który opracował tę wizualną technikę zarządzania projektami na początku drugiej dekady XX wieku. Pierwotnie opracowane z myślą o projektach produkcyjnych i budowlanych, wykresy były ręcznie rysowane na papierze i wymagały ręcznych aktualizacji za każdym razem, gdy oś czasu projektu ulegała zmianie.
Na przestrzeni dziesięcioleci to proste, ale skuteczne narzędzie znacznie ewoluowało. To, co początkowo miało formę papierową, przekształciło się w dynamiczne rozwiązania oparte na oprogramowaniu.
Nowoczesne narzędzia do tworzenia wykresów Gantta oferują obecnie współpracę w czasie rzeczywistym, automatyczne aktualizacje i integrację z innymi narzędziami do zarządzania projektami, co czyni je niezbędnymi w przypadku złożonych projektów.
Kluczowe funkcje oprogramowania do wykresów Gantta
Wykres Gantta zazwyczaj składa się z dwóch sekcji: lewa strona zawiera listę zadań, a prawa oś czasu projektu z paskami harmonogramu, które wizualizują pracę. Przyjrzyjmy się bliżej podstawowym komponentom wykresu Gantta.
Oś czasu
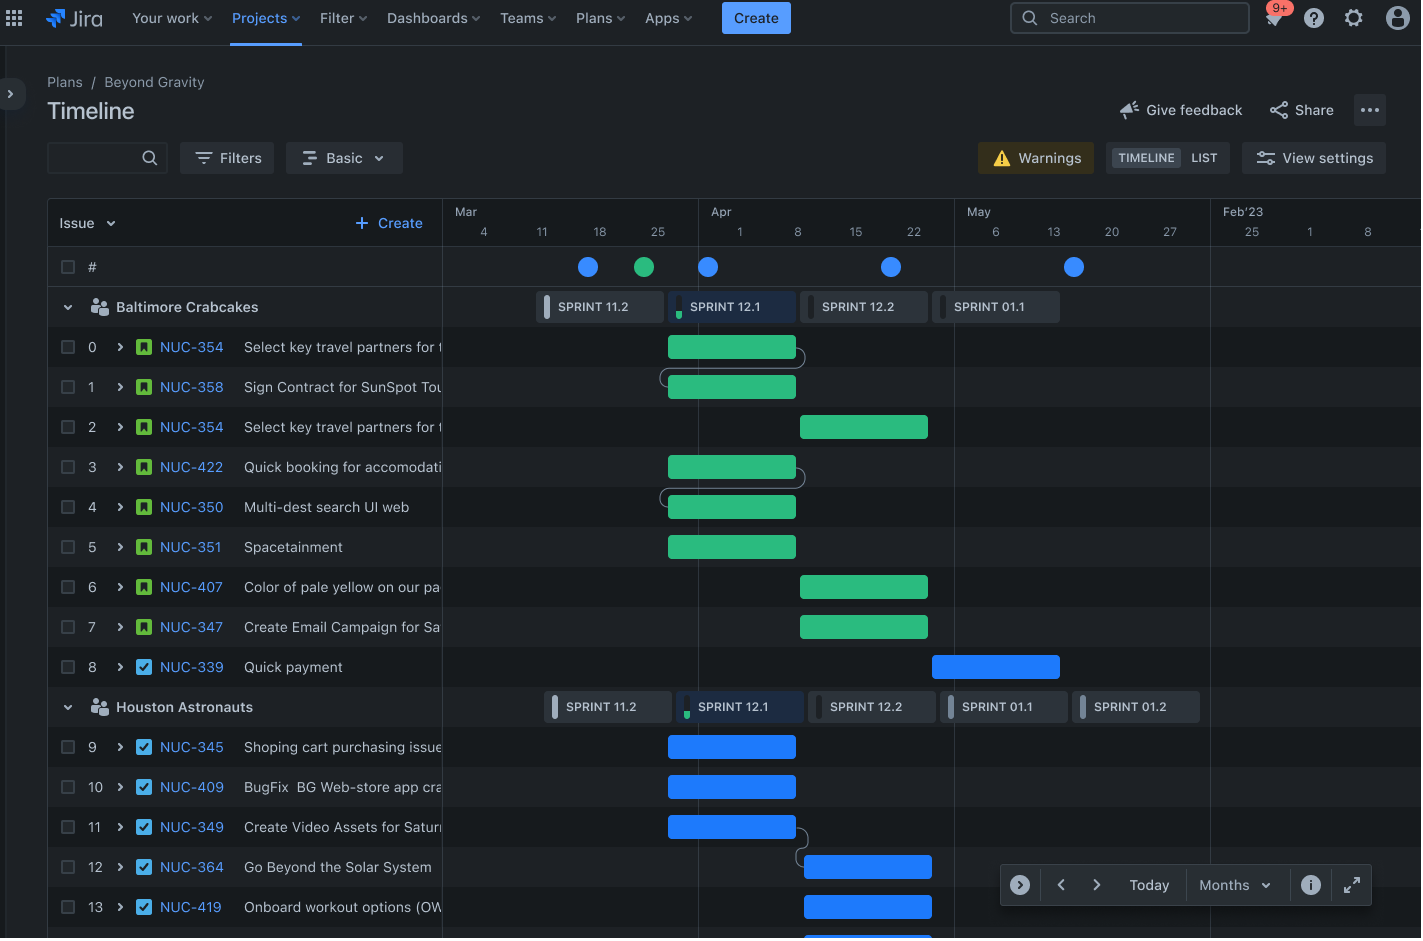
Oś czasu jest wizualną reprezentacją harmonogramu projektu, pokazującą daty rozpoczęcia i zakończenia u góry wykresu. Zapewnia ona przejrzysty widok harmonogramu projektu, pomagając wizualizować kolejność zadań i czas ich trwania.
Osie czasu pomagają wskazać potencjalne wąskie gardła i odpowiednio dostosować plany, aby projekt został zrealizowany w terminie. Przykładowo zespół marketingowy używa osi czasu do planowania wprowadzenia produktu na rynek, aby zagwarantować koordynację i terminową realizację wszystkich działań promocyjnych.
Zależności
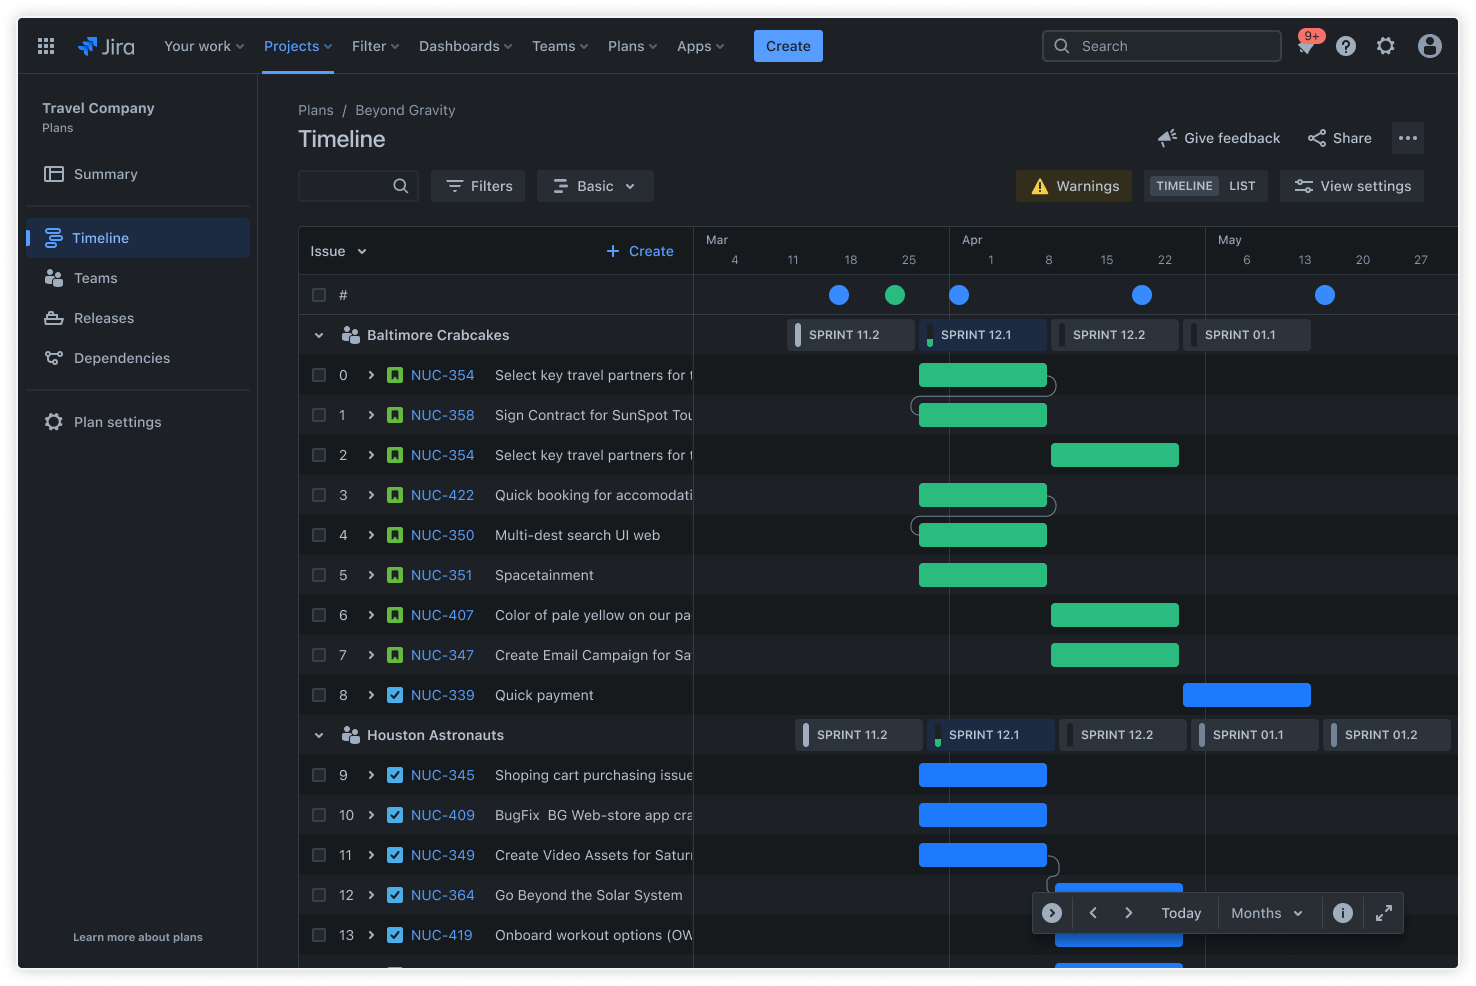
Powiązania między zadaniami dyktują kolejność operacji i pokazują sposób powiązania zadań. Dzięki Advanced Roadmaps można ustalić zależności między zadaniami, aby mieć pewność, że zostaną ukończone we właściwej kolejności.
Jednocześnie plan działań powinien automatycznie dostosowywać harmonogramy w przypadku wystąpienia zmian. Zapobiega to opóźnieniom dzięki temu, że zadania wstępne są wykonywane przed rozpoczęciem zadań zależnych. Przykładowo, w projekcie budowlanym występują zależności pozwalające na wykonanie fundamentów przed wzniesieniem konstrukcji.
Przydzielanie zasobów

Podziel duże projekty lub prace na mniejsze, łatwe do zarządzania części zwane „zgłoszeniami”. Wykorzystaj zgłoszenia do przechwytywania informacji o zadaniach i komunikatów o stanie prac, aby cały zespół mógł być na bieżąco.
Skuteczne zarządzanie zasobami sprawia, że członkowie zespołu nie są przeciążeni, a umiejętności są odpowiednio dobrane do wykonywanych zadań.
Lista
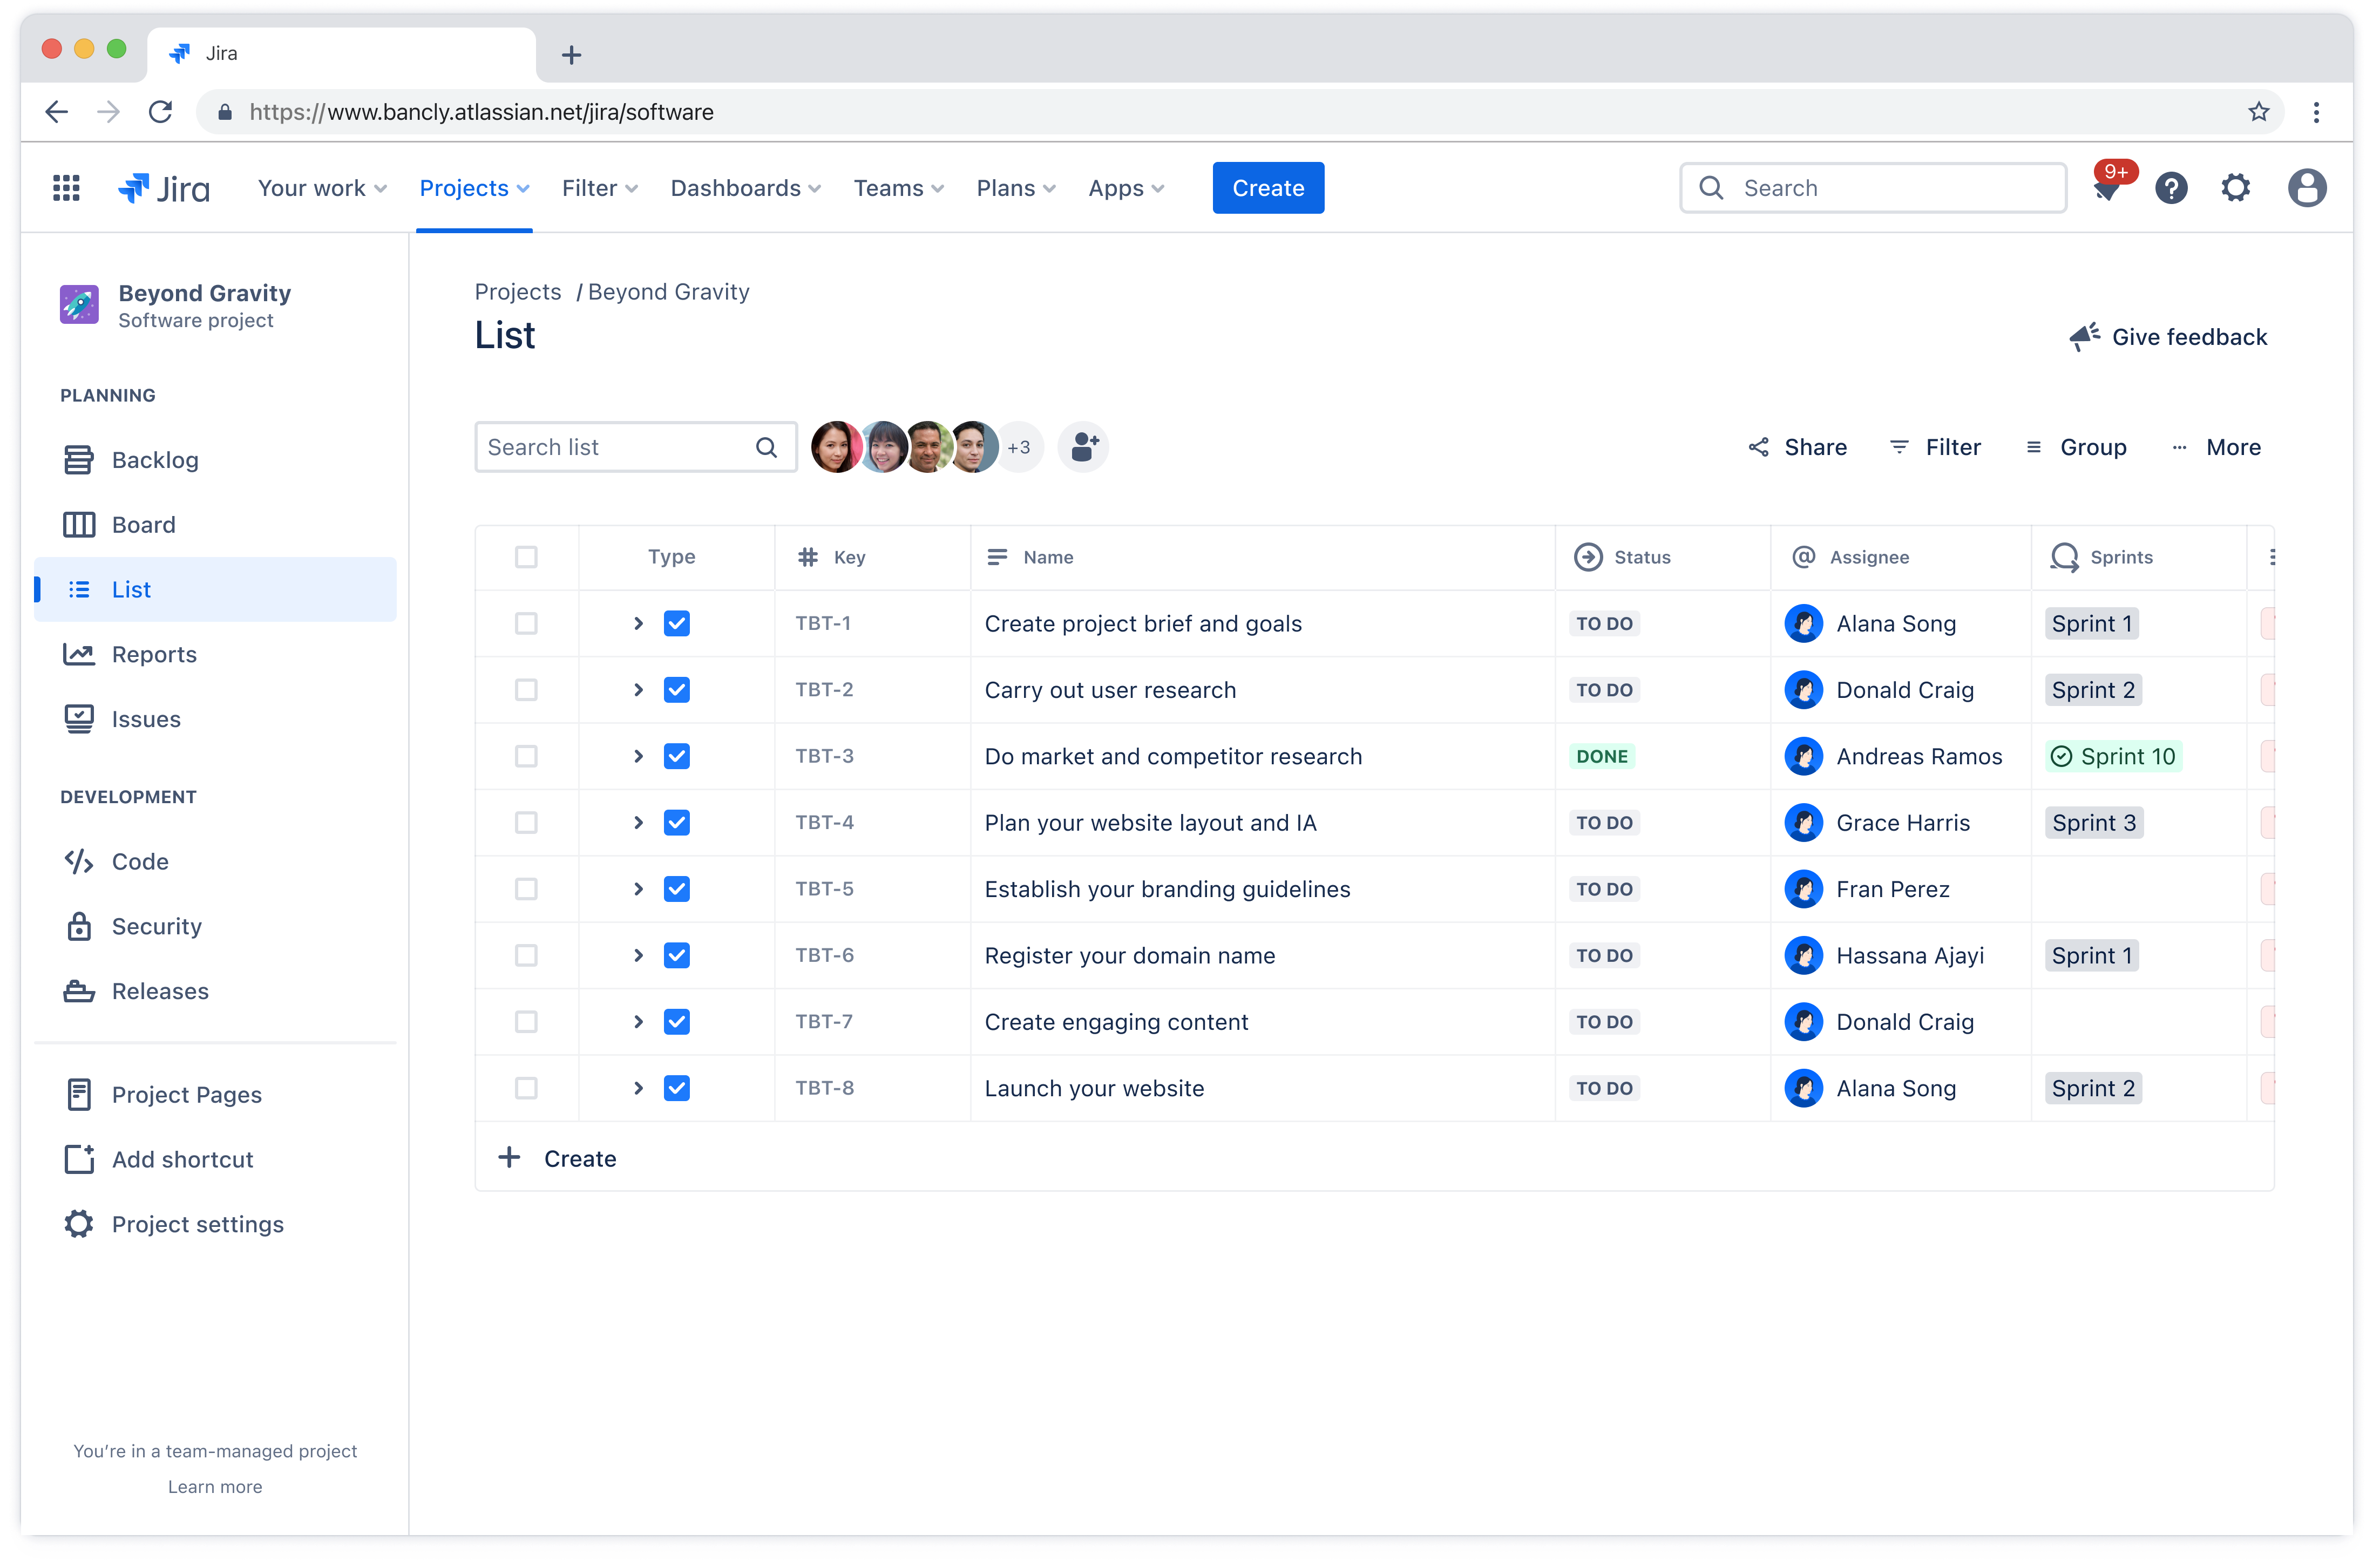
Lista zadań to obszerna lista wszystkich zadań wymaganych do ukończenia projektu. Oprogramowanie do zarządzania projektami umożliwia tworzenie zadań i zarządzanie nimi za pomocą narzędzia do śledzenia zgłoszeń.
Pozwala to na przypisywanie zadań członkom zespołu, ustalanie priorytetów i śledzenie postępów. Każdy członek zespołu zna swoje obowiązki i terminy, co sprzyja odpowiedzialności i wydajności.
Przykładowo zespół programistów używa listy zadań do przypisywania zadań kodowania, testowania i wdrażania różnym programistom, aby zapewnić sprawny przepływ pracy.
Kamienie milowe
Kamienie milowe projektu na wykresach Gantta to znaczniki na osi czasu projektu, wskazujące istotny postęp lub zakończenie faz projektu. Za pomocą odpowiednich narzędzi możesz zaznaczyć kluczowe kamienie milowe za pomocą znaczników kamieni milowych, które pomogą zespołowi skupić się na krytycznych terminach i osiągnięciach.
Kamienie milowe sprzyjają utrzymaniu motywacji i poczuciu sukcesu, a przez to pomagają zespołom skupić się na celach długofalowych. Przykładowo, zespół ds. rozwoju produktu wyznacza kamień milowy ukończenia fazy prototypu, który sygnalizuje gotowość do testów użytkowych.
Plusy i minusy korzystania z wykresów Gantta
Jak każde narzędzie do zarządzania projektami, wykresy Gantta mają właściwe sobie zalety i ograniczenia, które zespoły powinny wziąć pod uwagę.
Kluczowe zalety wykresów Gantta
Przejrzystość wizualna: zespoły mają natychmiastowy wgląd w postępy projektu, zbliżające się terminy i relacje między zadaniami.
Ulepszone planowanie: format wizualny ułatwia identyfikację potencjalnych konfliktów i planowanie ich eliminowania.
Usprawniona komunikacja: interesariusze mogą szybko zorientować się w statusie projektu bez konieczności zagłębiania się w szczegółowe raporty.
Skuteczniejsze zarządzanie czasem: przejrzyste osie czasu pomagają zespołom skupić się na priorytetach.
Istotne ograniczenia wykresów Gantta
Złożoność w dużych projektach: w przypadku zarządzania setkami zadań szablony wykresów Gantta mogą stać się przytłaczające.
Wymagania dotyczące konserwacji: aby wykresy były dokładne i użyteczne, muszą być regularnie aktualizowane.
Krzywa uczenia się: niektórzy członkowie zespołu mogą wymagać przeszkolenia, aby móc skutecznie odczytywać i aktualizować wykresy.
Kiedy (a kiedy nie) używać wykresów Gantta
Wykresy Gantta wypadają lepiej w określonych scenariuszach, ale nie zawsze są najlepszym wyborem w przypadku każdego typu projektu.
Idealne przykłady zastosowania są następujące:
Duże projekty oparte na osi czasu: gdy wykonanie projektu obejmuje wiele faz i zależności.
Inicjatywy interdyscyplinarne: projekty wymagające koordynacji między różnymi działami lub zespołami.
Praca skierowana do klienta: gdy interesariusze potrzebują jasnego wglądu w postęp projektu i jego rezultaty.
Chociaż wykresy Gantta oferują rozbudowane możliwości wizualizacji, mogą czasami niepotrzebnie komplikować prezentację prostszych przepływów pracy. W następujących przypadkach warto rozważyć zastosowanie prostszych narzędzi:
Zarządzanie małymi, elastycznymi projektami: sprinty Agile mogą skorzystać z większej liczby tablic Kanban.
Praca z często zmieniającymi się wymaganiami: statyczne wykresy mogą szybko stać się nieaktualne.
Kierowanie kreatywnymi projektami: gdzie proces ma charakter bardziej eksploracyjny niż liniowy.

Kto powinien używać wykresów Gantta?
Wykresy Gantta nie są przeznaczone wyłącznie dla kierowników projektów - to narzędzia przydatne dla każdego, kto musi koordynować złożoną pracę obejmującą określony okres czasu i zespoły. Role, które najbardziej korzystają z wykresów Gantta to:
Menedżerowie projektu: menedżerowie projektu używają tych wykresów do kompleksowego nadzoru i planowania strategicznego w wielu inicjatywach. Format wizualny pozwala im dostrzec potencjalne konflikty między projektami, efektywnie przydzielać zasoby i na bieżąco informować interesariuszy o postępach.
Liderzy zespołów: liderzy zespołów używają wykresów Gantta do koordynowania pracy w swoich działach lub obszarach funkcjonalnych. Mogą sprawdzić, kiedy dokładnie członkowie zespołu są dostępni, zidentyfikować potencjalne wąskie gardła, zanim się pojawią, i upewnić się, że wyniki są zgodne z szerszymi osiami czasu projektu.
Menedżerowie ds. operacji: menedżerowie ds. operacji wykorzystują format wykresu Gantta do zarządzania powtarzającymi się procesami i optymalizacji zarządzania zasobami w swoich organizacjach. Inaczej niż w przypadku pracy opartej na projektach, działania operacyjne często wiążą się z cyklicznymi czynnościami, które wymagają starannej koordynacji w celu utrzymania wydajności.
Należy pamiętać, że zastosowania branżowe znacznie się różnią. Przykładowo ekipy budowlane szeroko wykorzystują wykresy Gantta do koordynowania prac i zarządzania dostawami materiałów, dzięki czemu wylewanie betonu następuje po wykonaniu szalunków, a prace elektryczne rozpoczynają się dopiero po ukończeniu montażu konstrukcji szkieletowej.
Jednocześnie zespoły programistów dostosowują wykresy Gantta do planowania wydania i rozwoju funkcji, często integrując je z metodologiami Agile w celu wizualizacji planowania sprintów w dłuższych ramach czasowych.
Jak utworzyć wykres Gantta
Mając na uwadze zalety wykresów Gantta, zbadajmy, jak przełożyć plany projektów na przejrzysty i praktyczny wykres. Omówimy podstawowe kroki — od zdefiniowania zakresu prac po śledzenie postępów, aby się upewnić, że wykres Gantta stanie się cennym narzędziem do udanej realizacji projektu.
Możesz zacząć na dwa sposoby: utworzyć wykres Gantta od podstaw, wykonując poniższe kroki, lub skorzystać z naszego darmowego szablonu, który zawiera gotowe sekcje i przykłady, które ułatwią Ci konfigurację.
Pobierz darmowy szablon wykresu Gantta
Krok 1: Zdefiniowanie zakresu projektu
Pierwszym krokiem podczas tworzenia wykresu Gantta jest zdefiniowanie zakresu projektu. Zacznij od określenia głównych celów projektu. Jasne cele pozwolą pokierować projektem i zapewnią zgodność wszystkich zadań z tymi celami w całym cyklu życia projektu.
Gdy już osiągniesz cele projektu, nakreśl kluczowe rezultaty. To namacalne wyniki, które musisz osiągnąć w trakcie całego projektu. Confluence oferuje szablon planowania projektu mający za zadanie usprawnić proces zarządzania projektami.
Prowadzi on przez początkowy etap definiowania zakresu projektu i planowania z jasno określonymi kamieniami milowymi. Po ustaleniu planu projektu można płynnie przejść do tworzenia zadań dla każdego kamienia milowego i rezultatu, co gwarantuje uporządkowany i wydajny przepływ pracy.
Krok 2: Sporządzenie listy wszystkich zadań i zadań podrzędnych
Następnie wymień wszystkie zadania niezbędne do osiągnięcia każdego rezultatu. Te duże podziel na mniejsze zadania podrzędne, aby wyraźnie pokazać zespołowi, co musi zrobić. Zidentyfikuj każde zadanie, odpowiedzialnego za nie członka zespołu oraz wymagane zasoby.
Korzystanie ze zgłoszeń w Jirze stanowi skuteczny sposób na tworzenie i organizowanie tych zadań w ramach struktury wykresu Gantta. Każde zgłoszenie może reprezentować konkretne zadanie lub zadanie podrzędne, co pozwala na przypisywanie członków zespołu, ustalanie priorytetów i śledzenie postępów bezpośrednio na osi czasu projektu.
Porada eksperta: Rovo integruje się z aplikacjami Jira i Confluence, aby płynnie przekształcać plany projektów w szczegółowe zadania w Jirze, usprawniając przepływ pracy i zwiększając produktywność. Odkryj już dziś, jak Rovo przekształca plany projektów w praktyczne zgłoszenia Jiry.
Krok 3: Oszacowanie czasu trwania zadania
Określ, ile czasu zajmie wykonanie każdego zadania. Podejdź do sprawy realistycznie i weź pod uwagę wszelkie potencjalne opóźnienia. Pozostaw w harmonogramie bufor, aby przygotować się na nieoczekiwane opóźnienia i zapewnić terminowe ukończenie projektu.
Krok 4: Określenie zależności między zadaniami
Zidentyfikuj kolejność zadań. Niektóre zadania mogą się rozpocząć dopiero po ukończeniu innych. Do definiowania relacji między zadaniami używaj typów zależności, takich jak „od zakończenia do rozpoczęcia” lub „od rozpoczęcia do rozpoczęcia”.
Dzięki funkcji Advanced Roadmaps w Jirze noszącej nazwę Plany zespoły mogą tworzyć kompleksowe harmonogramy projektów, które wizualizują powiązania między zadaniami i automatycznie dostosowują osie czasu w przypadku wystąpienia zmian. Dzięki temu wykres Gantta pozostaje dokładny w miarę postępów projektu.
Krok 5: Wybranie narzędzia do utworzenia wykresu Gantta
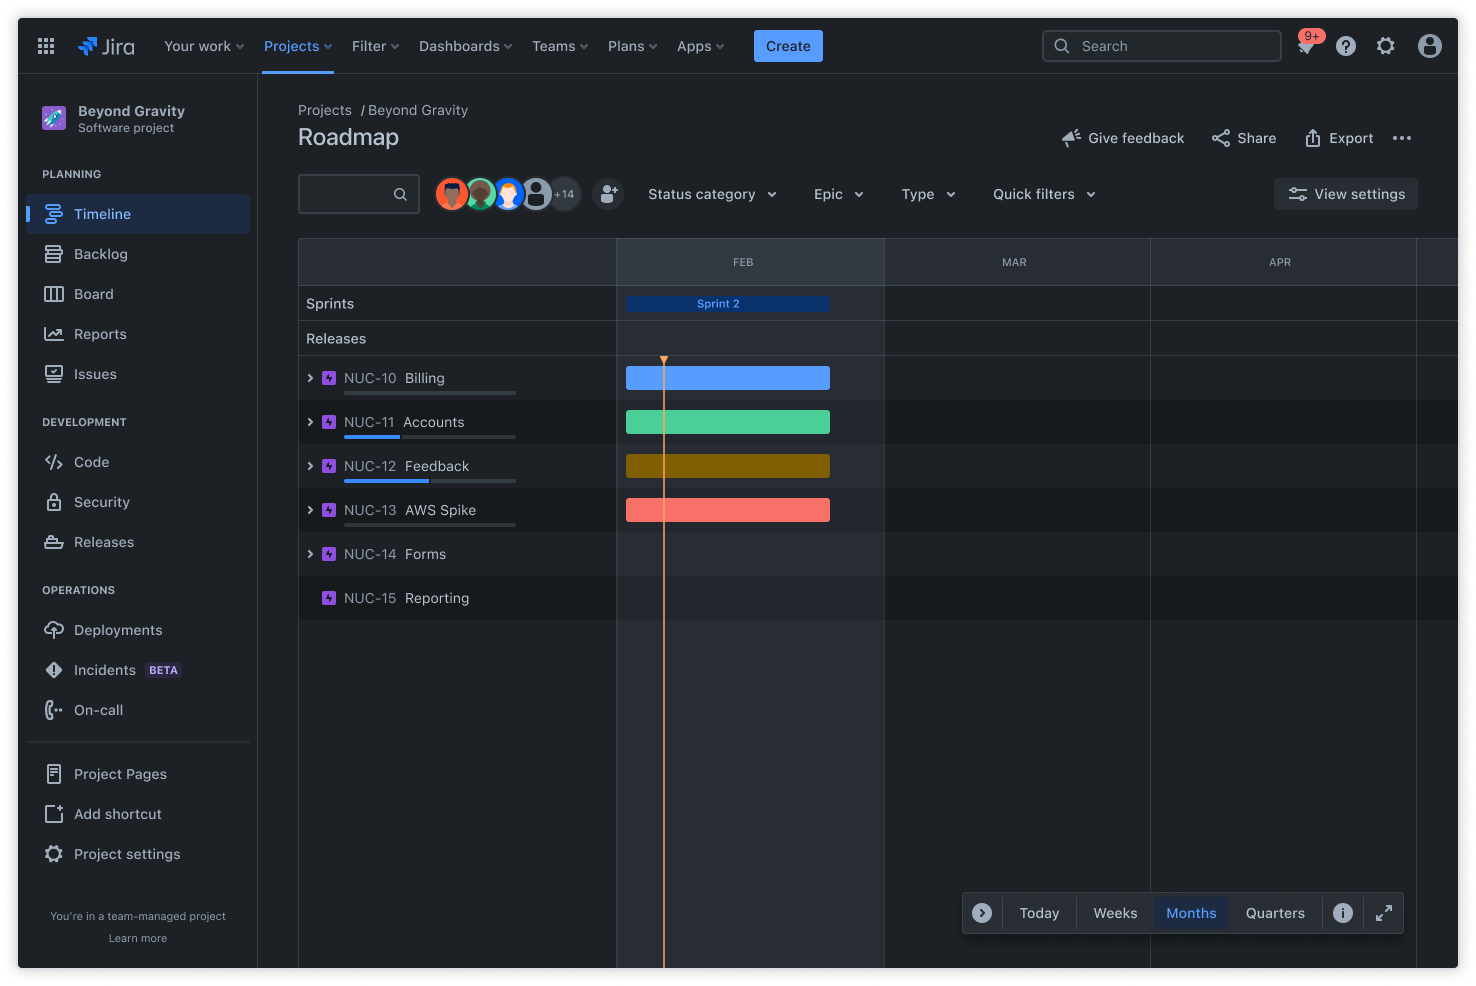
Wybierając narzędzie do tworzenia wykresów Gantta, weź pod uwagę kilka czynników, aby się upewnić, że spełnia ono potrzeby Twojego projektu.
Jira to świetne rozwiązanie do tworzenia wykresów Gantta, szczególnie w przypadku zespołów programistycznych i marketingowych. Narzędzia, takie jak Osie czasu czy Plany, pomagają tworzyć zaawansowane harmonogramy. Te funkcje obsługują szczegółowe zarządzanie zadaniami, śledzenie zależności i alokację zasobów. W celu usprawnienia procesu możesz nawet użyć szablonu wykresu Gantta.
Wypróbuj darmowe oprogramowanie do wykresów Gantta
Krok 6: Wprowadzenie danych
W Jirze nie ma potrzeby ręcznego wprowadzania danych do wykresu Gantta. Po utworzeniu zadań z planu projektu możesz łatwo przełączyć się na widok osi czasu lub skorzystać z Advanced Roadmaps w Jirze, aby uzyskać perspektywę podobną jak w wykresie Gantta.
Funkcja ta automatycznie uwzględnia czas trwania zadań, zależności i kluczowe kamienie milowe, dzięki czemu oś czasu projektu jest zawsze aktualna i prawidłowo wizualizowana.
Usprawnianie projektów dzięki wykresom Gantta w Jirze
Jira usprawnia planowanie i realizację projektów dzięki zaawansowanej wizualizacji na osi czasu oraz wydajnym funkcjom śledzenia zgłoszeń. Dynamiczna funkcja osi czasu w Jirze automatycznie aktualizuje wykresy, aby odzwierciedlić zmiany w zadaniach, terminach i zależnościach, dzięki czemu plan projektu jest zawsze aktualny.
Dzięki Advanced Roadmaps zyskujesz widok na poziomie portfolio, idealny do zarządzania złożonymi inicjatywami obejmującymi wiele zespołów. Ta funkcja wykracza poza proste sekwencjonowanie zadań i automatycznie oblicza wpływ zmian na całą oś czasu projektu, wskazując zadania, których dotyczą opóźnienia.
Confluence uzupełnienia Jirę poprzez usprawnienie przepływu pracy w zakresie zarządzania projektami oraz wdrażania osi czasu. Podczas gdy Jira wyróżnia się w zakresie realizacji i śledzenia, Confluence pełni rolę centralnego centrum dokumentacji projektu, gromadzenia wymagań i komunikacji z interesariuszami.
Możesz osadzać bieżące osie czasu Jira bezpośrednio na stronach Confluence, tworząc kompleksowe pulpity projektu, które łączą wizualne harmonogramy ze szczegółowym kontekstem projektu, notatkami ze spotkań i raportami o statusie.
Gantt Chart Frequently Asked Questions
What is the main purpose of a Gantt chart?
A Gantt chart is a visual timeline used to plan, schedule, and track tasks and milestones throughout a project's lifecycle. It helps teams coordinate work, manage dependencies, and communicate progress.
What are the 7 important elements of a Gantt chart?
Key elements of a Gantt chart include the timeline, task list, dependencies, resource allocation, milestones, progress tracking, and assignees. These components provide a comprehensive view of project status and responsibilities.
What are common mistakes when making a Gantt chart?
Common mistakes include overcomplicating the chart, failing to update it regularly, not accounting for dependencies, and underestimating task durations. These issues can lead to confusion and project delays.
What are the 5 steps to building a Gantt chart?
The five steps are: define the project scope, list all tasks and subtasks, estimate task durations, determine task dependencies, and choose a Gantt chart tool to visualize and manage the schedule.
Polecane dla Ciebie
Szablony
Gotowe szablony Jira
Przejrzyj naszą bibliotekę niestandardowych szablonów Jira dla różnych zespołów, działów i przepływów pracy.
Przewodnik po produktach
Kompleksowe wprowadzenie do Jira
Skorzystaj z tego przewodnika krok po kroku, aby poznać podstawowe funkcje oraz najlepsze praktyki i pracować wydajniej.
Przewodnik po Git
Zrozumienie podstaw Git
Dla początkujących i zaawansowanych ekspertów — ten przewodnik po Git pomoże Ci opanować podstawy dzięki pomocnym samouczkom i poradom