Gantt 차트란 무엇입니까? 주요 기능 및 이점, 유용한 템플릿 포함
Gantt 차트는 프로젝트 수명 주기 전반에 걸쳐 작업 및 마일스톤을 추적할 수 있도록 도와주는 시각적인 타임라인입니다.

무료 Gantt 차트 템플릿 시작해 보기
프로젝트 효율성을 높이고 싶으십니까? 이 템플릿을 사용하여 원활한 공동 작업을 위해 타임라인, 작업 및 리소스를 시각적으로 계획, 예약 및 관리하세요.
주요 시사점
Gantt 차트는 효과적인 계획 및 추적을 위해 작업, 타임라인, 종속성 및 마일스톤을 매핑하는 시각적 프로젝트 관리 도구입니다.
복잡한 일정 관리를 간소화하고 리소스 할당을 개선하며 모든 이해 관계자에게 상위 수준의 개요를 제공합니다.
주요 구성 요소에는 공동 작업 및 진행률 모니터링에 도움이 되는 작업 목록, 타임라인, 종속성 및 마일스톤 등이 있습니다.
다음 프로젝트를 위한 Gantt 차트를 만들어 가시성 및 협업을 강화하고 정시 제공을 보장합니다.
프로젝트 일정에 대한 개요 또는 여러 팀이 참여하고 마감 날짜가 바뀌는 복잡한 계획을 더 수월하게 관리할 방법을 찾고 계신가요?
이제 사용자 지정 Gantt 차트를 고려할 때입니다.
이 보기는 프로젝트 매니저 및 팀이 사일로에 갇히지 않고 체계성을 유지하고 함께 목표를 달성하는 데 집중할 수 있도록 지원합니다. 사용자 지정 가능한 Gantt 차트는 프로젝트 수명 주기의 타임라인으로도 사용할 수 있습니다.
이렇게 하면 작업 및 마일스톤을 추적하고 이해 관계자와 진행률을 공유할 수 있습니다. 스프린트를 관리하든 장기 프로젝트를 관리하든, 이 포괄적인 가이드에서는 Gantt 차트란 무엇인지, 실제 활용 방법, 이점 및 지금 바로 시작할 수 있는 무료 템플릿을 자세히 살펴봅니다.
Gantt 차트란 무엇입니까?
Gantt 차트는 프로젝트 내에서 다양한 작업 및 활동을 계획하고 그 진행률을 추적하는 데 사용되는 애자일 프로젝트 관리 도구입니다. 시각적 타임라인 역할을 하는 Gantt 차트는 작업 목록, 시작 날짜 및 종료 날짜, 마일스톤, 작업 간의 종속성 및 담당자를 표시합니다.
유용한 로드맵인 Gantt 차트는 팀과 조직이 업무 항목을 효과적으로 계획하고 조정할 수 있도록 안내합니다. 작업 간 상호 연결을 보여주어 프로젝트 이해 관계자가 원활하게 공동 작업하고 정렬 상태를 유지하도록 합니다.
잘 정의되고 시각적으로 명확한 Gantt 차트를 사용하면 모두가 같은 정보를 공유하고 같은 목표를 향해 나아갈 수 있습니다.
Gantt 차트의 역사
Gantt 차트 형식은 1910년대 초에 Henry Gantt가 개발한 시각적 프로젝트 관리 기법에서 유래합니다. 원래는 제조 및 건설 프로젝트를 위해 설계된 이 차트는 종이에 손으로 그려서 프로젝트 타임라인이 변경될 때마다 수동으로 업데이트해야 했습니다.
간단하면서도 효과적인 Gantt 차트는 수십 년 동안 상당한 발전을 거쳤습니다. 정적인 종이 차트로 시작한 것이 동적인 소프트웨어 기반 솔루션으로 변모했습니다.
오늘날의 Gantt 차트 만들기 도구는 이제 실시간 공동 작업, 자동 업데이트 및 다른 프로젝트 관리 도구와의 통합을 제공하므로, 복잡한 프로젝트에 없어서는 안 될 도구로 자리 잡았습니다.
Gantt 차트 소프트웨어의 주요 특징
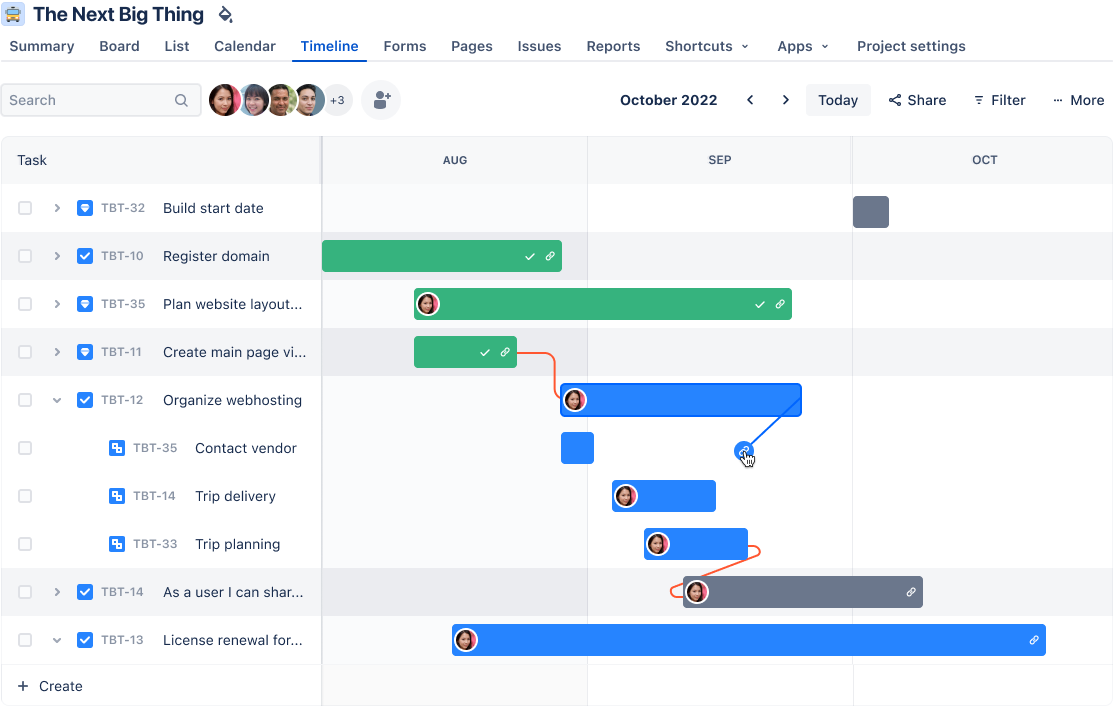
Gantt 차트에는 일반적으로 두 개의 섹션이 있습니다. 왼쪽에는 작업 목록이 있고 오른쪽에는 업무를 시각화하는 일정 막대가 있는 프로젝트 타임라인이 표시됩니다. Gantt 차트의 주요 구성 요소에 대해 자세히 살펴보겠습니다.
타임라인
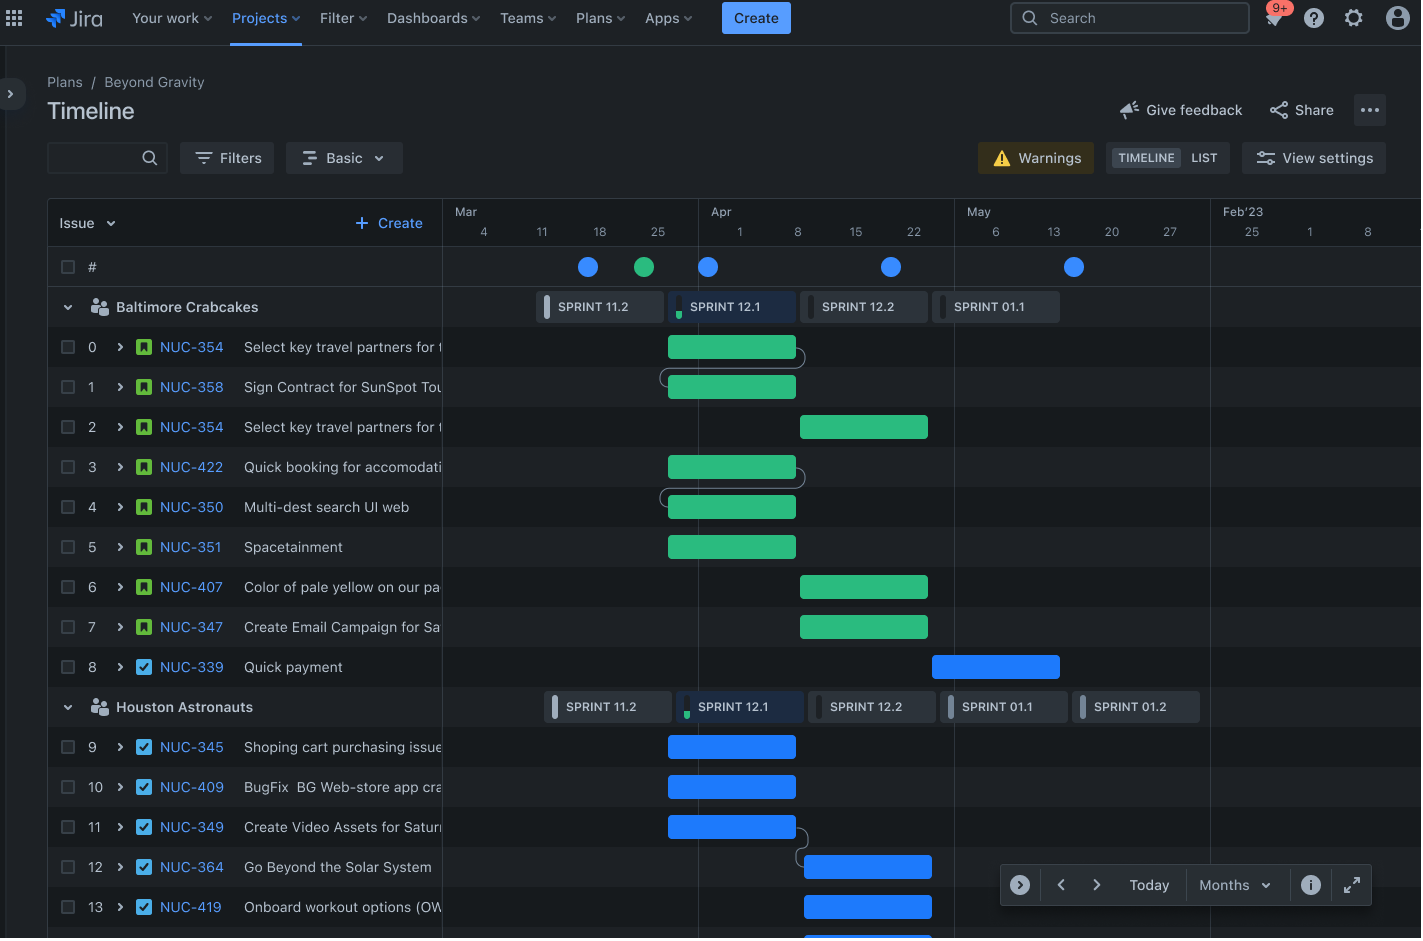
타임라인은 프로젝트 일정을 시각적으로 표현한 것으로, 차트 상단에는 시작 날짜 및 종료 날짜가 표시됩니다. 프로젝트 일정을 명확하게 보여주어 작업 순서 및 기간을 시각화하는 데 도움이 됩니다.
타임라인을 통해 잠재적 병목 상태를 식별하고 프로젝트가 계획대로 진행되도록 사전에 조정할 수 있습니다. 예를 들어, 마케팅 팀은 타임라인을 사용하여 제품 제공 계획을 세우고 모든 프로모션 활동이 정렬되고 일정대로 실행되도록 합니다.
종속성
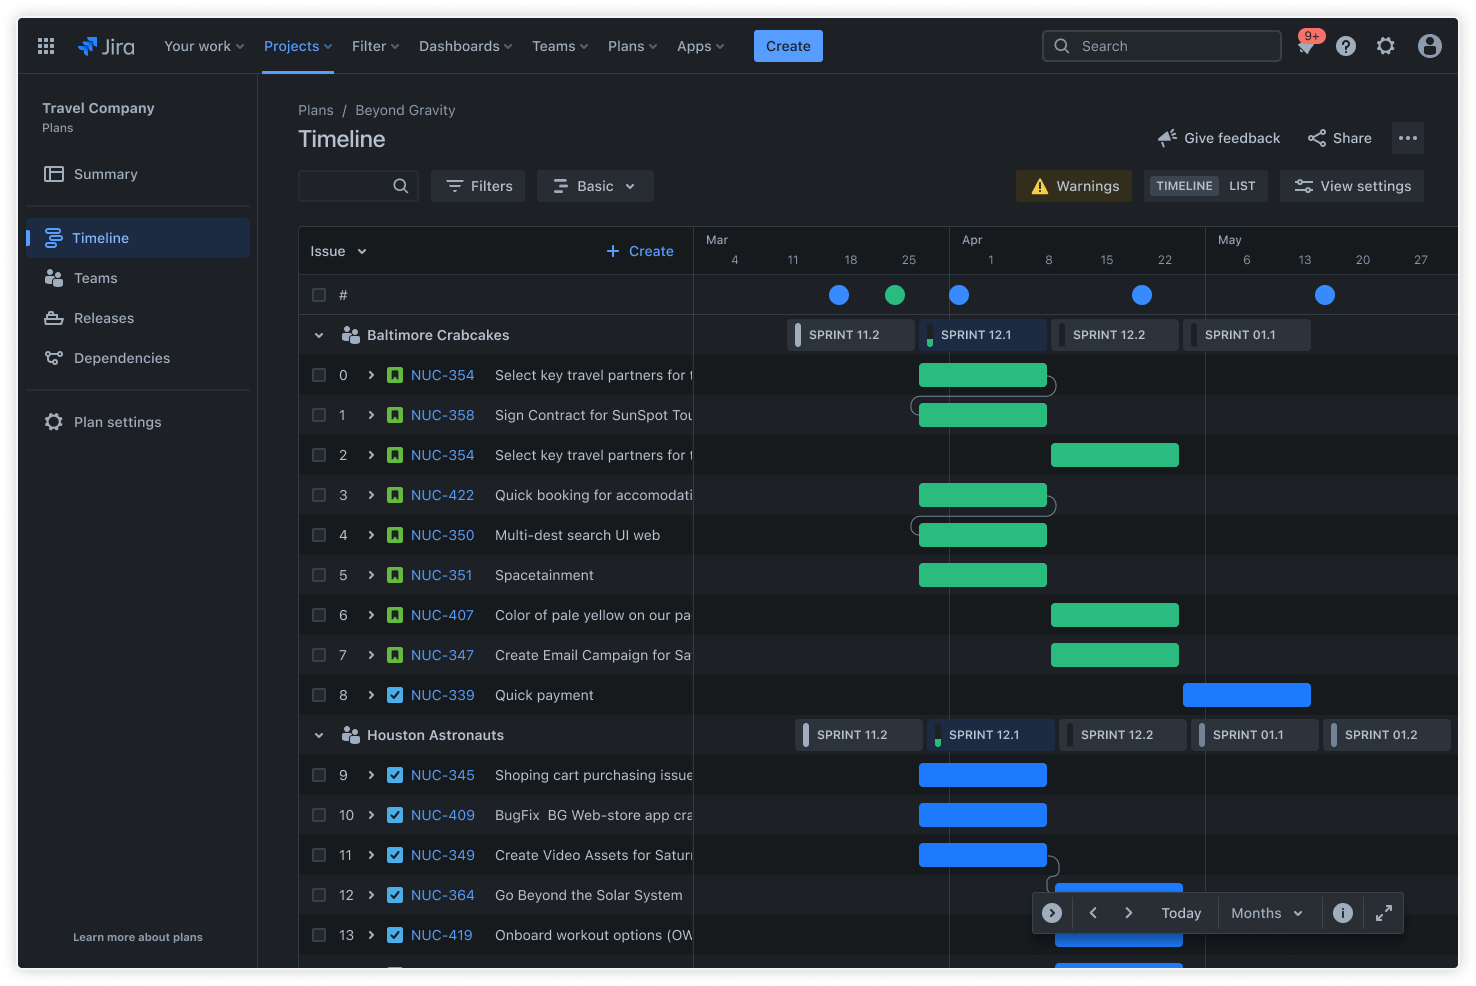
작업 간의 링크는 작업 순서를 지정하고 작업이 어떻게 연관되어 있는지 보여 줍니다. Advanced Roadmaps를 사용하면 작업 간의 종속성을 설정하여 올바른 순서로 완료되도록 할 수 있습니다.
동시에 로드맵은 변경이 발생하면 일정을 자동으로 조정할 수 있어야 합니다. 그래야 종속 작업이 시작되기 전에 선행 작업이 완료되도록 하여 지연을 방지할 수 있습니다. 건설 프로젝트에는 구조물을 짓기 전에 기초 공사가 완료되도록 하는 종속성이 있습니다.
리소스 할당

큰 프로젝트나 업무를 '업무 항목'이라고 하는 작고 관리하기 쉬운 부분으로 나누세요. 팀 전체가 최신 상태를 유지할 수 있도록 업무 항목을 사용하여 작업 정보 및 상태 업데이트를 캡처하세요.
효과적인 리소스 관리를 통해 팀원이 과도한 업무 부담을 느끼지 않고 팀원의 스킬이 작업에 적절하게 부합하도록 할 수 있습니다.
목록
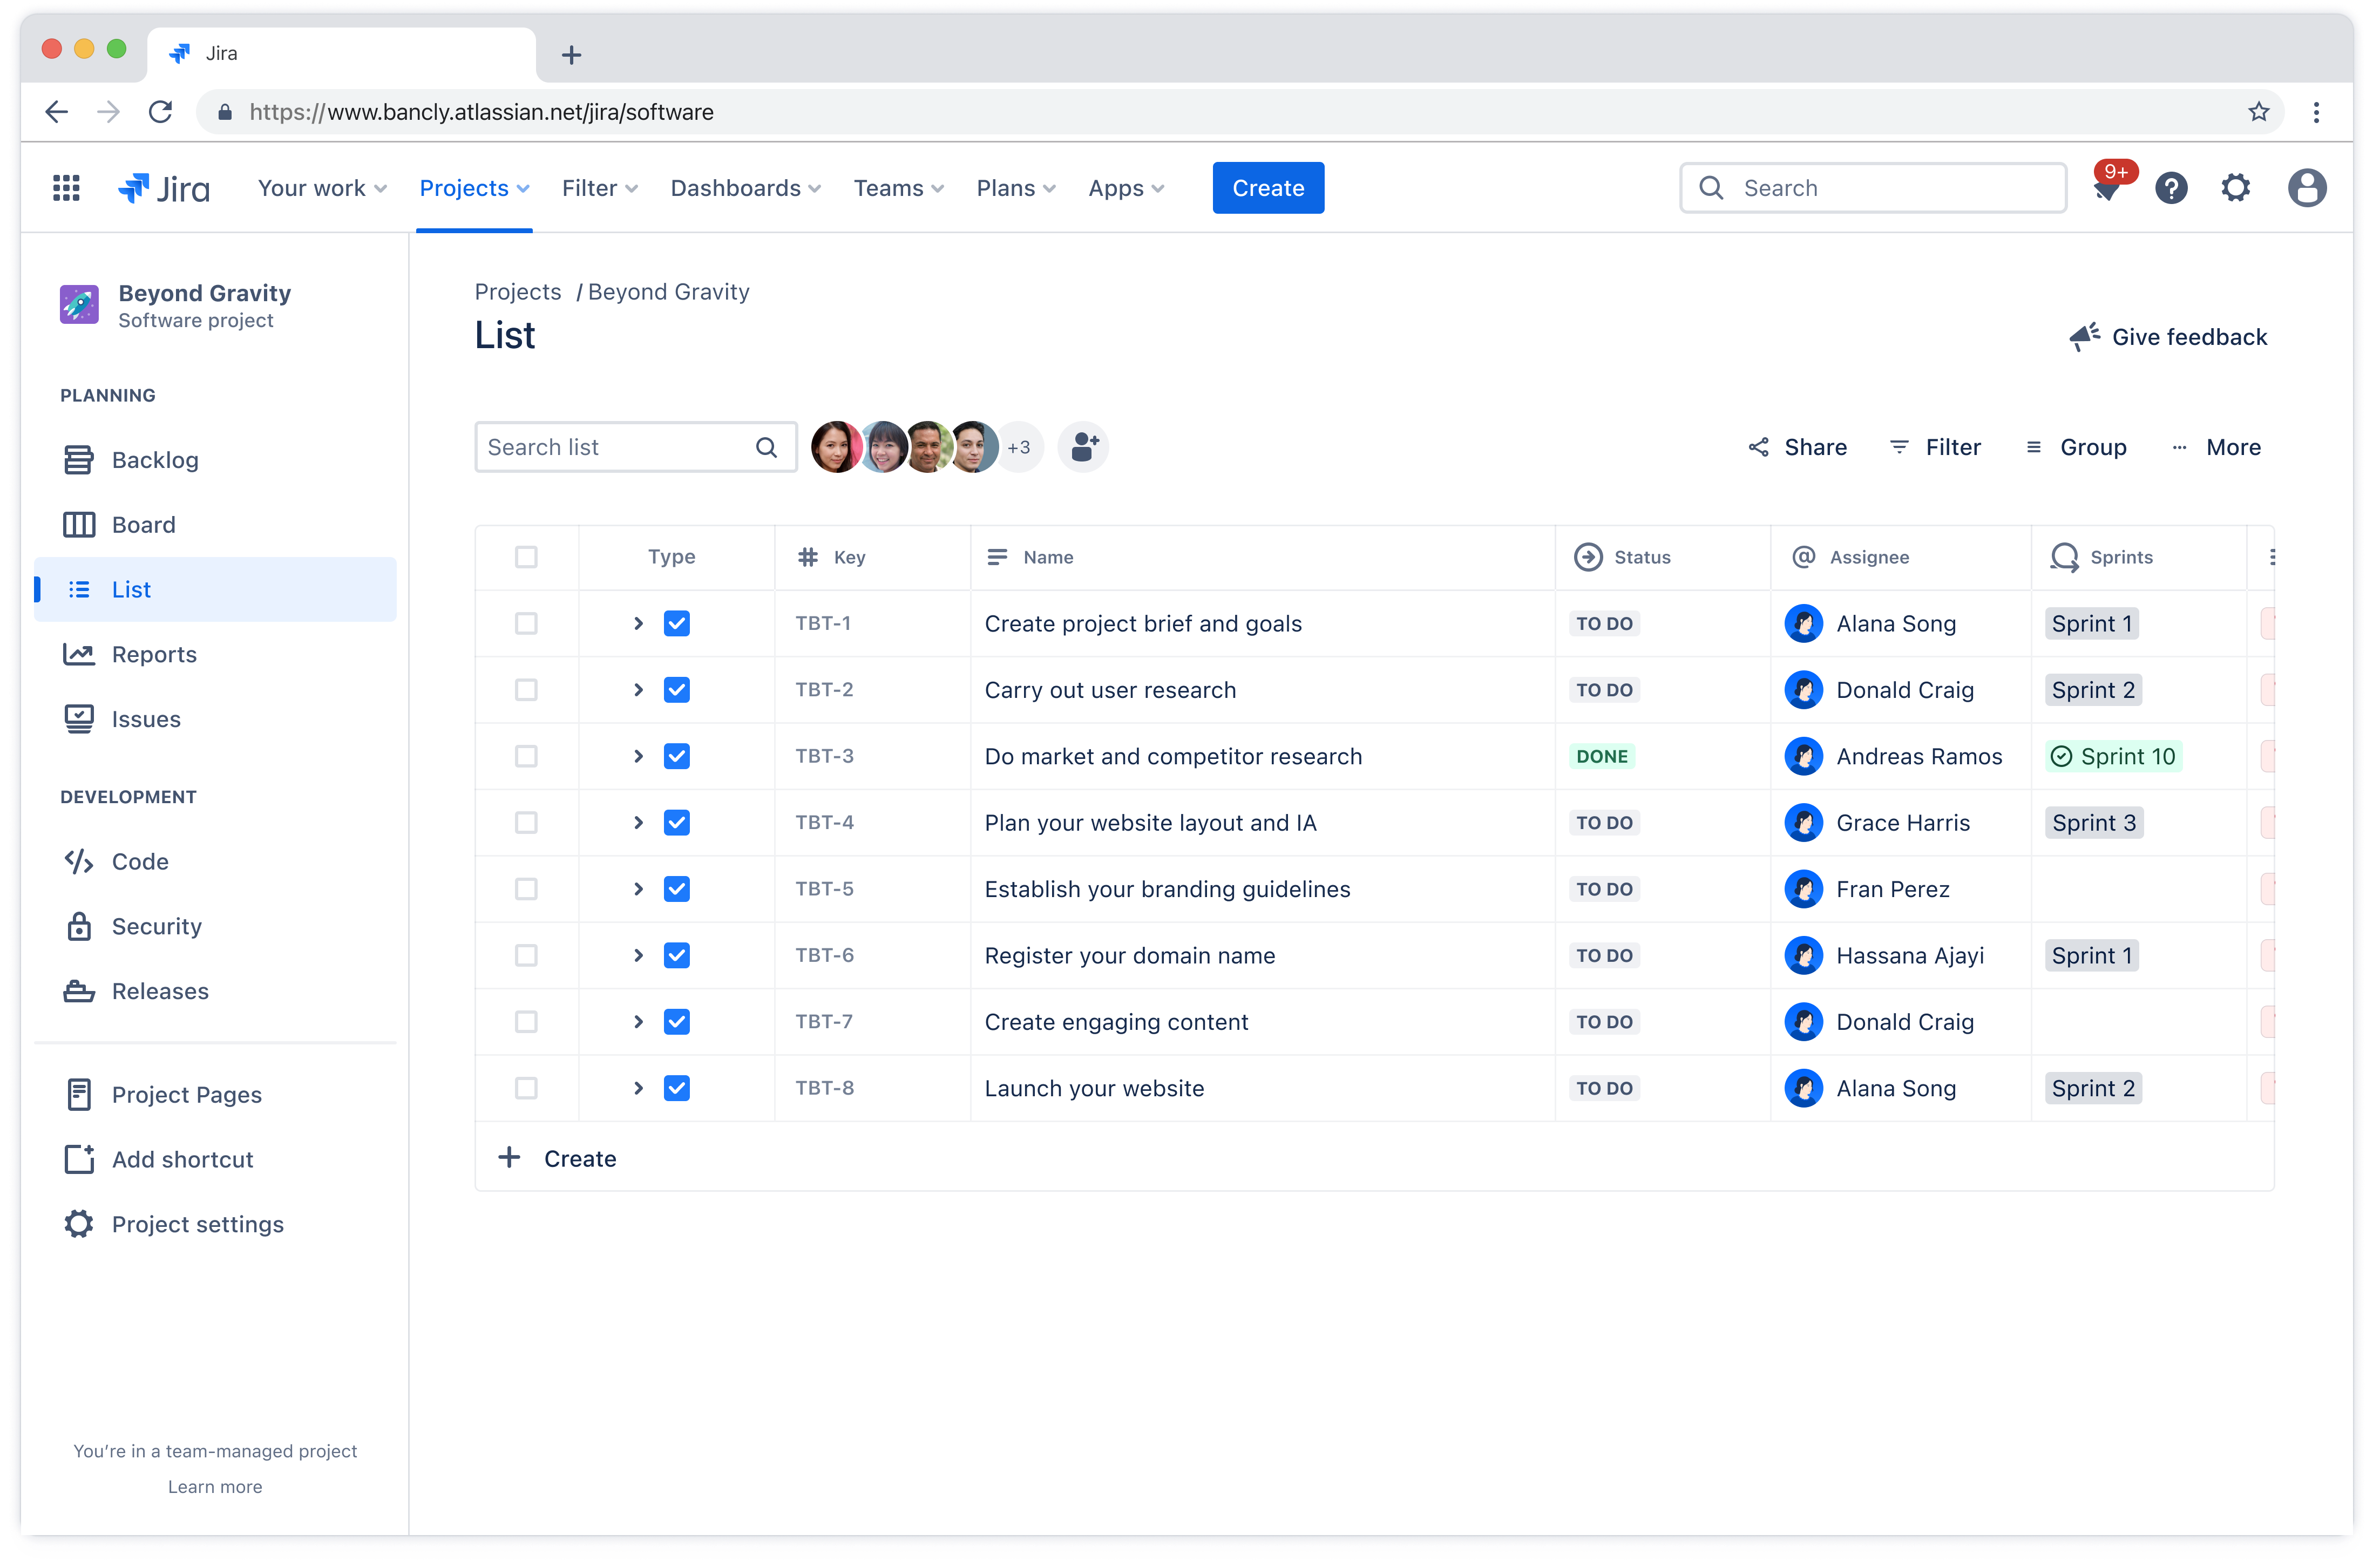
작업 목록은 프로젝트를 완료하는 데 필요한 모든 작업이 있는 종합적인 목록입니다. 프로젝트 관리 소프트웨어를 사용하면 업무 항목 추적기를 사용하여 작업을 생성하고 관리할 수 있습니다.
그러면 팀원에게 작업을 할당하고 우선 순위를 지정하며 진행률을 추적할 수 있습니다. 모든 팀원은 자신의 책임 및 마감 날짜를 알고 책임 의식 및 효율성을 높일 수 있습니다.
예를 들어 소프트웨어 개발 팀은 작업 목록을 사용하여 코딩, 테스트 및 배포 작업을 여러 개발자에게 할당하여 워크플로를 원활하게 유지합니다.
마일스톤
Gantt 차트의 프로젝트 마일스톤은 프로젝트 타임라인에서 프로젝트 단계의 주요 진행률 또는 완료 상태를 나타내는 마커입니다. 적합한 도구가 있으면 마일스톤 마커로 주요 마일스톤을 표시하여 팀이 중요한 마감 날짜 및 성과에 집중할 수 있습니다.
마일스톤은 동기 부여 및 성취감을 제공하여 팀이 장기 목표에 계속 집중할 수 있도록 합니다. 예를 들어, 제품 개발 팀은 프로토타입 단계를 완료하는 마일스톤을 설정하여 사용자 테스트 준비 상태를 알릴 수 있습니다.
Gantt 차트 사용의 장단점
다른 모든 프로젝트 관리 도구와 마찬가지로 Gantt 차트에는 팀이 고려해야 할 뚜렷한 장점 및 한계가 있습니다.
Gantt 차트의 주요 장점
시각적 선명도: 팀은 프로젝트 진행률, 예정된 마감 날짜 및 작업 관계를 한눈에 즉시 확인할 수 있습니다.
향상된 계획: 시각적 형식을 사용하면 잠재적 갈등을 쉽게 파악하고 이것에 맞춰 계획을 세울 수 있습니다.
커뮤니케이션 개선: 이해 관계자가 상세한 보고서를 주의 깊게 살펴보지 않고도 프로젝트 상태를 빠르게 이해할 수 있습니다.
더 나은 시간 관리: 명확한 타임라인은 팀이 우선 순위에 집중할 수 있도록 도와줍니다.
Gantt 차트의 주요 한계
대규모 프로젝트의 복잡성: Gantt 차트 템플릿은 수백 개의 작업을 관리할 때 너무 복잡해질 수 있습니다.
유지 관리 요구 사항: 차트를 정확하고 유용하게 유지하려면 정기적인 업데이트가 필수적입니다.
학습 곡선: 일부 팀원은 차트를 효과적으로 읽고 업데이트하기 위해 교육이 필요할 수 있습니다.
Gantt 차트를 사용해야 하는 경우(그리고 사용하지 않아야 하는 경우)
Gantt 차트는 특정 시나리오에서 탁월하지만 모든 프로젝트 유형에 항상 가장 적합한 선택은 아닙니다.
이상적인 사용 사례는 다음과 같습니다.
타임라인 중심의 대규모 프로젝트: 여러 단계 및 종속성이 포함되는 프로젝트 실행의 경우.
교차 부서 이니셔티브: 서로 다른 부서 또는 팀 간의 조정이 필요한 프로젝트의 경우.
고객 대면 업무: 이해 관계자가 프로젝트 진행률 및 산출물에 대한 명확한 가시성을 필요로 하는 경우.
Gantt 차트는 강력한 시각화 기능을 제공하지만 때로는 단순한 워크플로에 불필요한 복잡성을 초래할 수 있습니다. 다음 경우에는 더 간단한 대안을 고려해 보세요.
작고 유연한 프로젝트를 관리하는 경우: 애자일 스프린트는 칸반 보드를 활용할 때 더 큰 이점을 얻을 수 있습니다.
자주 변경되는 요구 사항을 다루는 경우: 정적인 차트는 금세 뒤처질 수 있습니다.
창의적 프로젝트를 이끄는 경우: 과정이 선형적이기보다 탐색적인 경우에 사용하면 좋습니다.

누가 Gantt 차트를 사용해야 합니까?
Gantt 차트는 단지 프로젝트 관리자만을 위한 도구가 아니라 시간 및 팀을 넘어 복잡한 업무를 조율해야 하는 모두에게 유용한 도구입니다. Gantt 차트의 이점을 가장 잘 활용하는 역할은 다음과 같습니다.
프로젝트 매니저: 프로젝트 매니저는 이 차트를 사용하여 여러 이니셔티브에 대해 종합적으로 감독하고 전략적 계획을 세웁니다. 차트의 시각적 형식 덕분에 프로젝트 간 잠재적 갈등을 파악하고 리소스를 효율적으로 할당하며 이해 관계자에게 진행률을 한눈에 전달할 수 있습니다.
팀 리더: 팀 리더는 Gantt 차트를 사용하여 특정 부서 또는 기능 영역 내에서 업무를 조정합니다. 팀원이 정확히 언제 업무가 가능한지 확인하고 잠재적인 병목 상태를 사전에 파악하며 산출물이 전체 프로젝트 타임라인과 정렬되도록 보장할 수 있습니다.
운영 매니저: 운영 매니저는 Gantt 차트 형식을 사용하여 반복되는 프로세스를 관리하고 조직 전체의 리소스 관리를 최적화합니다. 프로젝트 기반 작업과 달리 운영 업무는 효율성을 유지하기 위해 세심한 조정이 필요한 반복적인 활동을 포함하는 경우가 많습니다.
산업별로 응용되는 방식은 상당히 다르다는 점을 명심하세요. 예를 들어, 건설 팀은 Gantt 차트를 광범위하게 사용하여 거래를 조정하고 자재 제공을 관리합니다. 따라서 거푸집이 설치된 후 콘크리트 타설이 이루어지고, 골조 공사가 완료된 후에만 전기 작업이 시작됩니다.
한편, 소프트웨어 개발 팀은 릴리스 계획 및 기능 개발에 Gantt 차트를 사용해 왔습니다. 대개 Gantt 차트를 애자일 방법론과 통합하여 장기간에 걸친 스프린트 계획을 시각화하기도 합니다.
Gantt 차트를 만드는 방법
Gantt 차트의 이점을 염두에 두고 프로젝트 계획을 명확하고 실행 가능한 차트로 변환하는 방법을 살펴봅니다. Gantt 차트가 성공적인 프로젝트 실행을 위한 유용한 도구가 될 수 있도록 업무 범위 정의부터 진행률 추적까지의 필수 단계를 다루어 봅니다.
시작하는 방법에는 두 가지가 있습니다. 아래 단계에 따라 Gantt 차트를 처음부터 새로 만들거나 설정을 안내하는 사전 작성된 섹션 및 예시가 포함된 무료 템플릿을 사용하여 바로 시작할 수 있습니다.
1단계: 프로젝트 범위 정의
Gantt 차트를 만드는 첫 단계는 프로젝트 범위를 정의하는 것입니다. 가장 먼저 프로젝트의 주요 목표를 파악합니다. 명확한 목표는 프로젝트를 이끌며 프로젝트 수명 주기 내내 모든 작업이 이 목표와 정렬되도록 보장합니다.
프로젝트 목표가 정해지면 주요 산출물을 간략히 설명합니다. 프로젝트 전반에 걸쳐 산출해야 하는 실질적인 성과를 의미합니다. Confluence는 프로젝트 관리 프로세스를 간소화해 주는 프로젝트 계획 템플릿을 제공합니다.
Confluence는 프로젝트 범위를 정의하고 명확한 마일스톤을 세워 계획하는 초기 단계에 도움이 됩니다. 프로젝트 계획을 세웠으면 각 마일스톤 및 산출물에 대한 작업을 손쉽게 만들 수 있어 체계적이고 효율적인 워크플로가 보장됩니다.
2단계: 모든 작업 및 하위 작업 나열
다음으로 각 산출물을 완료하는 데 필요한 모든 작업을 나열합니다. 큰 작업을 작은 하위 작업으로 나눠 팀이 해야 할 일을 명확하게 보여 줍니다. 각 작업, 작업을 담당하는 팀원 및 필요한 리소스를 파악합니다.
Jira의 업무 항목을 사용하는 것은 Gantt 차트 구조 내에서 이 작업을 만들고 체계화하는 효과적인 방법입니다. 각 업무 항목은 특정 작업 또는 하위 작업을 나타낼 수 있으므로 프로젝트 타임라인 내에서 팀원을 할당하고 우선 순위를 설정하고 진행률을 직접 추적할 수 있습니다.
프로 팁: Rovo는 Jira 및 Confluence와 통합되어 프로젝트 계획을 Jira 내의 세부 작업으로 원활하게 변환하여 워크플로를 간소화하고 생산성을 높입니다. 지금 Rovo가 어떻게 프로젝트 계획을 실행 가능한 Jira 티켓으로 전환하는지 알아보세요!
3단계: 작업 기간 추정
각 작업을 완료하는 데 걸리는 시간을 결정합니다. 현실적으로 생각하고 잠재적 지연을 모두 고려하세요. 예상치 못한 지연을 수용하고 프로젝트가 순조롭게 진행되도록 일정에 완충 시간을 포함합니다.
4단계: 작업 종속성 결정
작업 순서를 파악합니다. 일부 작업은 다른 작업을 완료한 후에만 시작할 수 있습니다. 완료부터 시작까지 또는 시작부터 시작까지와 같은 종속성 유형을 사용하여 작업 간의 관계를 정의하세요.
Jira의 Advanced Roadmaps인 계획을 이용하면 팀은 작업 연결을 시각화하고 변경 사항이 발생할 때 일정을 자동으로 조정하는 포괄적인 프로젝트 로드맵을 만들 수 있습니다. 이렇게 하면 프로젝트가 진행되더라도 Gantt 차트가 정확하게 유지될 수 있습니다.
5단계: Gantt 차트 도구 선택
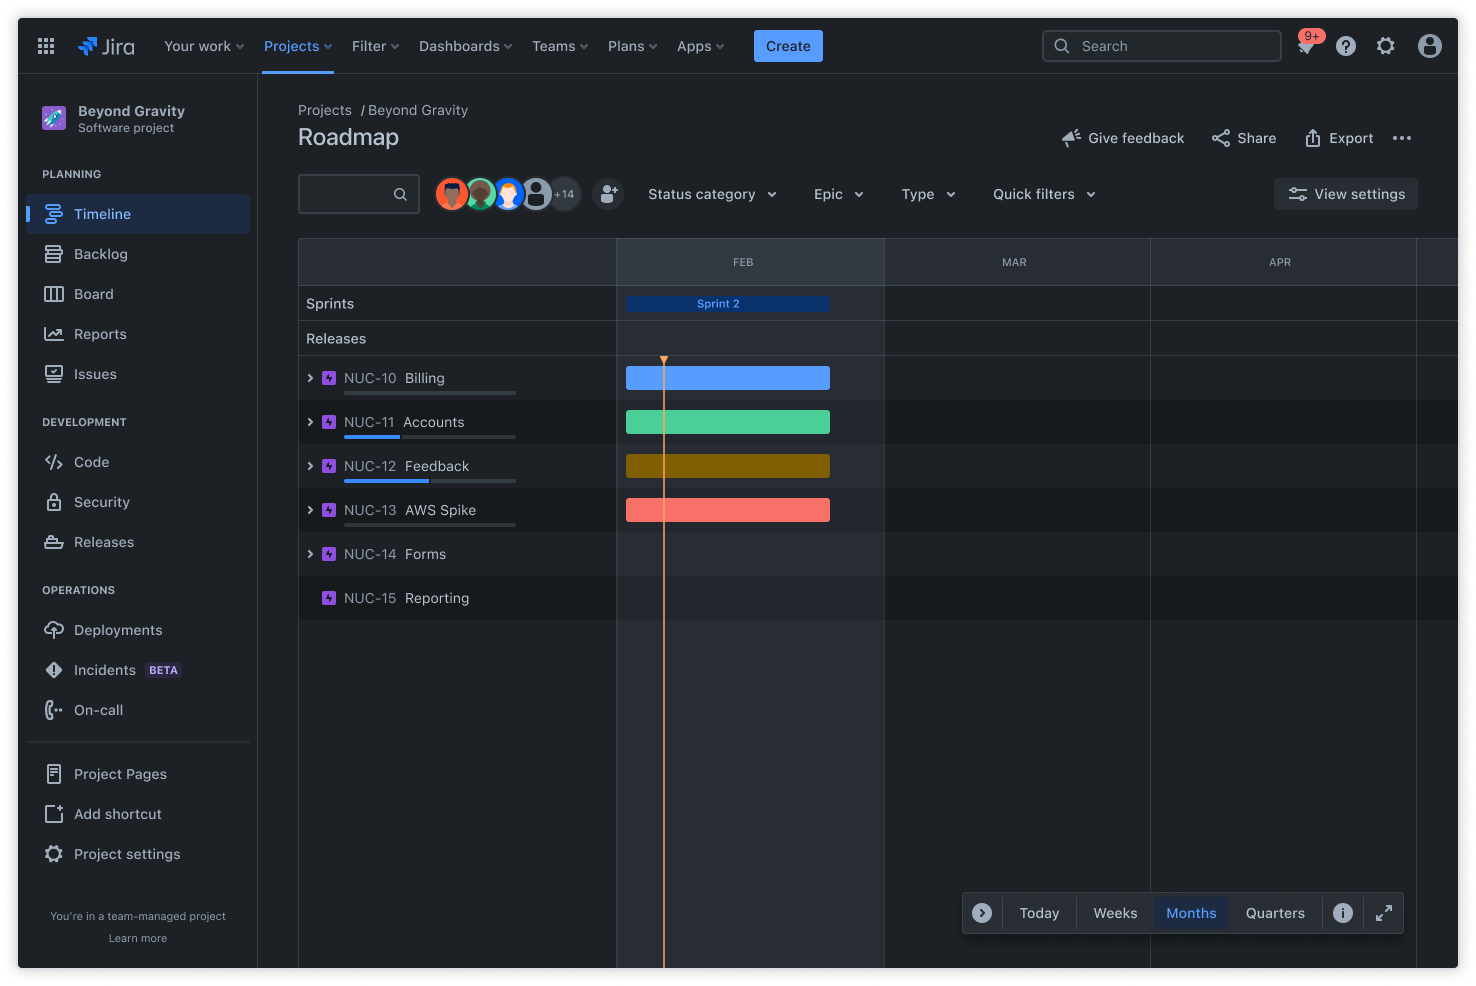
Gantt 차트 도구를 선택할 때는 도구가 프로젝트의 특정 요구 사항을 충족하도록 여러 주요 요소를 고려합니다.
Jira는 Gantt 차트를 만들 때 특히 소프트웨어 및 마케팅 팀에 유용한 옵션입니다. 타임라인 및 계획과 같은 도구를 사용하면 Advanced Roadmaps를 만들 수 있습니다. 위의 기능은 자세한 작업 관리, 종속성 추적 및 리소스 할당을 지원합니다. Gantt 차트 템플릿을 사용하여 프로세스를 간소화할 수도 있습니다.
6단계: 데이터 입력
Jira를 사용하면 Gantt 차트에 데이터를 수동으로 입력할 필요가 없습니다. 프로젝트 계획에서 작업을 생성한 후에는 손쉽게 타임라인 보기로 전환하거나 Jira의 Advanced Roadmaps를 활용하여 Gantt 차트와 같은 보기를 만들 수 있습니다.
이 기능은 작업 기간, 종속성 및 주요 마일스톤을 자동으로 반영하여 프로젝트 타임라인을 항상 최신 상태로 유지하고 정확하게 시각화합니다.
Jira에서 Gantt 차트로 프로젝트 간소화
Jira는 강력한 타임라인 시각화 및 강력한 업무 추적 기능을 통해 프로젝트 계획 및 실행을 개선합니다. Jira의 동적인 타임라인 기능은 작업, 날짜 및 종속성의 변경 사항을 반영하여 차트를 자동으로 업데이트하므로, 프로젝트 계획이 항상 최신 상태로 유지됩니다.
Advanced Roadmaps를 사용하면 포트폴리오 수준의 보기를 통해 여러 팀에 걸친 복잡한 이니셔티브를 관리할 수 있습니다. 단순한 작업 순서 결정 기능 그 이상을 제공하는 Advanced Roadmaps는 전체 프로젝트 타임라인에서 변경의 영향을 자동으로 계산하여 지연으로 인해 영향을 받는 작업을 강조 표시합니다.
Confluence는 프로젝트 관리 워크플로 및 타임라인 구현을 개선하여 Jira를 보완합니다. Jira는 실행 및 추적 기능이 뛰어나며, Confluence는 프로젝트 설명서, 요구 사항 수집 및 이해 관계자 커뮤니케이션을 위한 중앙 집중식 허브 역할을 합니다.
라이브 Jira 타임라인을 Confluence 페이지에 바로 포함하여 시각적 일정과 더불어 상세한 프로젝트 컨텍스트, 미팅 메모 및 상태 보고서가 결합된 포괄적인 프로젝트 대시보드를 만들 수 있습니다.
Gantt Chart Frequently Asked Questions
What is the main purpose of a Gantt chart?
A Gantt chart is a visual timeline used to plan, schedule, and track tasks and milestones throughout a project's lifecycle. It helps teams coordinate work, manage dependencies, and communicate progress.
What are the 7 important elements of a Gantt chart?
Key elements of a Gantt chart include the timeline, task list, dependencies, resource allocation, milestones, progress tracking, and assignees. These components provide a comprehensive view of project status and responsibilities.
What are common mistakes when making a Gantt chart?
Common mistakes include overcomplicating the chart, failing to update it regularly, not accounting for dependencies, and underestimating task durations. These issues can lead to confusion and project delays.
What are the 5 steps to building a Gantt chart?
The five steps are: define the project scope, list all tasks and subtasks, estimate task durations, determine task dependencies, and choose a Gantt chart tool to visualize and manage the schedule.