Summary: A Gantt chart is a visual timeline for tracking tasks and milestones throughout a project's lifecycle. It offers a high-level overview of project schedules, making it easier to manage complex plans involving multiple teams and shifting deadlines. By providing clear visibility, Gantt charts empower project managers and teams to stay organized and focused on achieving their goals together.
Whether you're managing sprints or long-term projects, this comprehensive guide explores what Gantt charts are, their practical applications, and the many benefits they offer.
什么是甘特图?
A Gantt chart is an agile project management tool used to plan and track the progress of various tasks and activities within a project. Serving as a visual timeline, it displays the list of tasks, their start and end dates, milestones, dependencies between tasks, and assignees.
As a valuable roadmap, a Gantt chart guides teams and organizations in effectively planning and coordinating their work items. By illustrating task interconnections, it fosters seamless collaboration and alignment among project stakeholders, ensuring everyone is on the same page and working towards the same goal.
使用甘特图的好处
甘特图有两个主要优点。
Simplifies complex planning
Gantt charts make it easier to create complex plans, particularly those involving multiple teams and shifting deadlines. They also help teams schedule tasks around deadlines and allocate resources efficiently.
Enhances task scheduling and resource allocation
Project planners rely on Gantt charts for a high-level overview, showing key details like task start and end dates, milestones, and dependencies. Modern Gantt chart programs like Jira Timelines and Jira's Advanced Planning synthesize information and illustrate how choices impact deadlines.
Gantt chart components
Gantt charts typically include two sections; the left side outlines a list of tasks, while the right side shows a project timeline with schedule bars that visualize work. Let's take a closer look at the primary components to look for in a Gantt chart.
任务列表

A task list is a comprehensive list of all tasks required to complete the project. In Jira, tasks can be created and managed using the issue tracker, which allows you to assign tasks to team members, set priorities, and track progress. This ensures that every team member knows their responsibilities and deadlines, promoting accountability and efficiency. For example, a software development team uses the task list to assign coding, testing, and deployment tasks to different developers, ensuring a smooth workflow.
时间线
The timeline is a visual representation of the project schedule, showing start and end dates at the top of the chart. Jira's Timeline feature provides a clear view of your project schedule, helping you visualize the sequence of tasks and their durations. Timelines help identify potential bottlenecks and allow for proactive adjustments to keep the project on track. For example, a marketing team uses the timeline to plan a product launch, ensuring all promotional activities are aligned and executed on time.
相关性
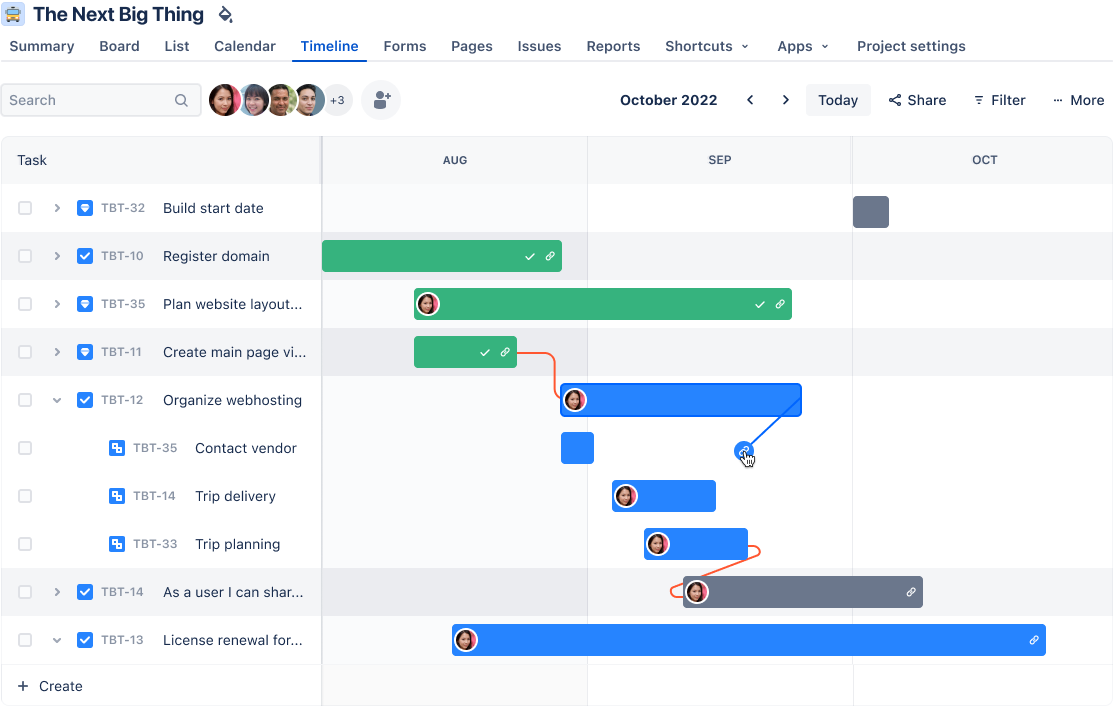
Links between tasks dictate the order of operations and show how tasks are related. Jira's Advanced Roadmaps allows you to set dependencies between tasks, ensuring that tasks are completed in the correct order and automatically adjusting schedules when changes occur. This prevents delays by ensuring that prerequisite tasks are completed before dependent tasks begin. In a construction project, for example, dependencies ensure that foundation work is completed before building the structure.
里程碑
Project milestones on Gantt charts are markers on the project timeline indicating major progress or completion of project phases. In Jira, you can mark key milestones using milestone markers, which help keep your team focused on critical deadlines and achievements. Milestones provide motivation and a sense of accomplishment, helping teams stay focused on long-term goals. A product development team sets a milestone for completing the prototype phase, signaling readiness for user testing.
甘特图有什么用途?
项目经理使用甘特图有三个主要原因。
构建和管理综合项目
甘特图可视化呈现项目的构建块,并将其整理为更小、更易于管理的任务。由此产生的任务以及任务之间的依赖关系、经办人和里程碑都在甘特图的时间线上。
确定物流和任务依赖关系
使用甘特图监控项目的物流。任务依赖关系可确保新任务只能在另一项任务完成后才能开始。任务延误会导致自动重新安排。在多团队环境中进行规划时,这一点尤其有用。
监控项目进度
当团队记录完成计划中工作项的时间时,您可以监控项目的运行状况,并在必要时进行调整。甘特图可以包括发布日期、里程碑或其他重要指标,以跟踪项目的进度。
如何创建甘特图
考虑到甘特图的优点,让我们来探讨如何将项目计划转化为清晰、可操作的图表。我们将介绍从定义项目范围到跟踪进度的基本步骤,以确保甘特图成为成功执行项目的宝贵工具。
Step 1: Define the project scope
创建甘特图的第一步是定义项目范围。首先要确定项目的主要目标。明确的目标将为项目提供指导,并确保所有任务在整个项目生命周期中与这些目标保持一致。
确定目标后,概述关键可交付成果。这些是您需要在整个项目中产生的有形成果。
Step 2: List all tasks and subtasks
接下来,列出完成每项可交付成果所需的每项任务。将大型任务分解成较小的子任务,以清楚地说明团队需要做什么。确定每项任务、负责的团队成员以及所需资源。
Step 3: Estimate task duration
确定完成每项任务需要多长时间。要切合实际,并考虑到任何可能的延误。在时间表中加入缓冲时间,以应对意外延误,确保项目按计划进行。
Step 4: Determine task dependencies
确定任务顺序。有些任务只有在其他任务完成后才能开始。使用“完成到开始”或“开始到开始”等依赖关系类型来定义任务之间的关系。
Step 5: Choose a Gantt chart tool
在选择甘特图工具时,应评估几个因素,确保工具满足项目需求。
Jira is an excellent option for creating Gantt charts, particularly for software development teams. Tools such as Timelines and Plans help you create advanced roadmaps. These features support detailed task management, dependency tracking, and resource allocation. You can even use a Gantt chart template to streamline the process.
Step 6: Input data
获得所有信息后,将数据输入所选工具。在甘特图中输入所有任务及其相应的工期。设置任务之间的依赖关系,确保顺序清晰。包含关键里程碑,以突出项目时间线中的重要节点。
创建有效甘特图的最佳实践
创建有效的甘特图不仅仅是输入数据那么简单。下面是一些需要遵循的最佳实践。
- 保持简单明了。避免在甘特图中加入过多信息,让其变得混乱不堪。少用颜色和标签,只包含最基本的任务和依赖关系。
- 使用颜色编码。颜色编码有助于更好地直观显示不同的任务类型或阶段。它能增强时间线视图的效果,更轻松地使跟踪进度一目了然。
- 清晰地沟通。使用清晰的任务描述、里程碑标记和依赖关系类型,确保所有团队成员都能理解甘特图。这将有助于避免混淆和错误。
- 与团队成员和利益相关者共享。与所有相关的利益相关者共享甘特图,确保整个团队保持一致。随时向每个人通报甘特图的任何变更或修订。
- 定期更新图表。甘特图应该是整个项目中定期更新的活文档。每完成或延迟一项任务,都要做出相应的更改,以保持时间线的准确性。
-
纳入反馈意见。定期征求团队的反馈意见,并将其纳入甘特图,以提高准确性和有效性。
How different stakeholders utilize Gantt charts
Gantt charts are versatile tools that cater to the diverse needs of various stakeholders within a project team. Here's how different roles utilize Gantt charts, the components they focus on, the questions they aim to answer, and the common challenges they face:
项目经理
Project managers use Gantt charts to oversee the entire project timeline, manage resources, and ensure deadlines are met.
Key questions: "Are we on track to meet our deadlines?" "What resources are needed at each phase?" "How do task dependencies affect the project timeline?"
Common challenges: As a project manager, juggling complex dependencies and resource allocation can be tricky. Jira's Advanced Roadmaps feature helps by automatically adjusting schedules when dependencies change and providing a clear view of resource allocation.
团队成员
Team members focus on their specific tasks and dependencies to understand their role in the larger project. They interact most with the task list and timeline components to track their responsibilities and deadlines.
Key questions: "What tasks am I responsible for?" "What are the deadlines for my tasks?" "How do my tasks fit into the overall project?"
Common challenges: Managing tasks and tracking changes and dependencies can be constantly shifting. Jira's real-time collaboration and issue tracker features ensure team members are always updated on task changes or dependencies shifts.
利益相关者
Stakeholders view high-level progress and milestones to stay informed about the project's status. They focus on milestones and visual aids to grasp the project's progress quickly.
Key questions: "What is the current status of the project?" "Have we reached key milestones?" "Are there any major risks or delays?"
Common challenges: When trying to understand complex project details, stakeholders can feel easily overwhelmed by information. Jira's customizable views and milestone markers provide stakeholders with a clear, high-level overview of the project, ensuring they are informed without being overwhelmed.
By leveraging Jira's robust features, each stakeholder can effectively use Gantt charts to meet their specific needs, ensuring a cohesive and well-managed project.
Key features of Gantt chart software
Gantt chart software, like Jira, offers advanced features to enhance project management efficiency and effectiveness. Here's why these features are essential:
Automatic scheduling
This feature automatically adjusts timelines when task dependencies change, ensuring your project plan remains accurate and up-to-date. It saves time and reduces the risk of human error, allowing project managers to focus on strategic planning rather than manual updates.
资源管理
Efficient resource allocation is crucial for project success. Effective resource management features help distribute tasks and resources across teams, optimizing workload and preventing burnout. This ensures that all team members are utilized effectively, contributing to a balanced and productive work environment.
实时协作
With real-time collaboration, team members can update progress and communicate changes instantly. This feature fosters transparency and keeps everyone aligned, reducing miscommunication and enhancing team cohesion. It is particularly beneficial for remote teams or projects with tight deadlines.
Customizable views
Different projects require different perspectives. Jira offers customizable views, such as daily, weekly, or monthly timelines, to suit various planning needs. This flexibility allows project managers to tailor their Gantt charts to specific project requirements, improving clarity and focus.
Integrations and compatibility
Gantt chart tools are most effective when they integrate seamlessly with other project management software and platforms. Jira excels in this area by offering robust integrations with tools like Trello and BigPicture. These integrations enable smooth project management across different systems, enhancing collaboration and efficiency.
By incorporating these features and integrations, Jira is a comprehensive solution for modern project management needs.
如何在 Jira 中使用甘特图
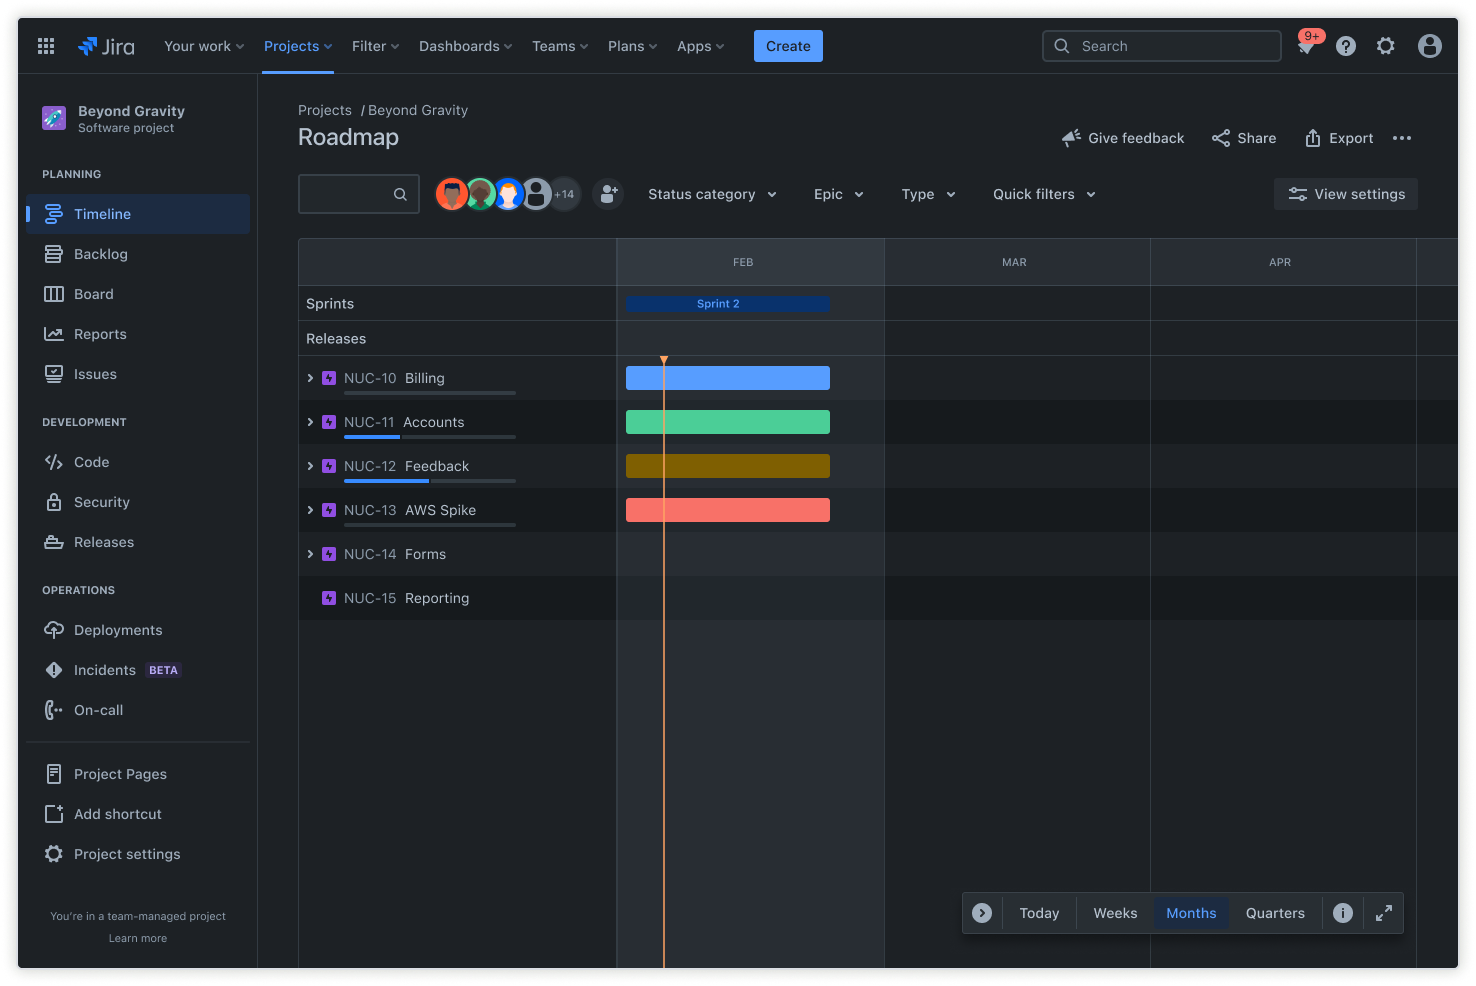
特定于项目的图表:Jira 时间线
以下屏幕截图取自时间线,显示特定于项目的甘特图,通常在团队层面或单个群组内使用。该图表显示跟踪团队实现目标的进展情况,项目经理可以通过其可折叠的工作分解结构来全面了解项目的关键故事。Jira 提供免费的项目管理模板,其中包括甘特图。

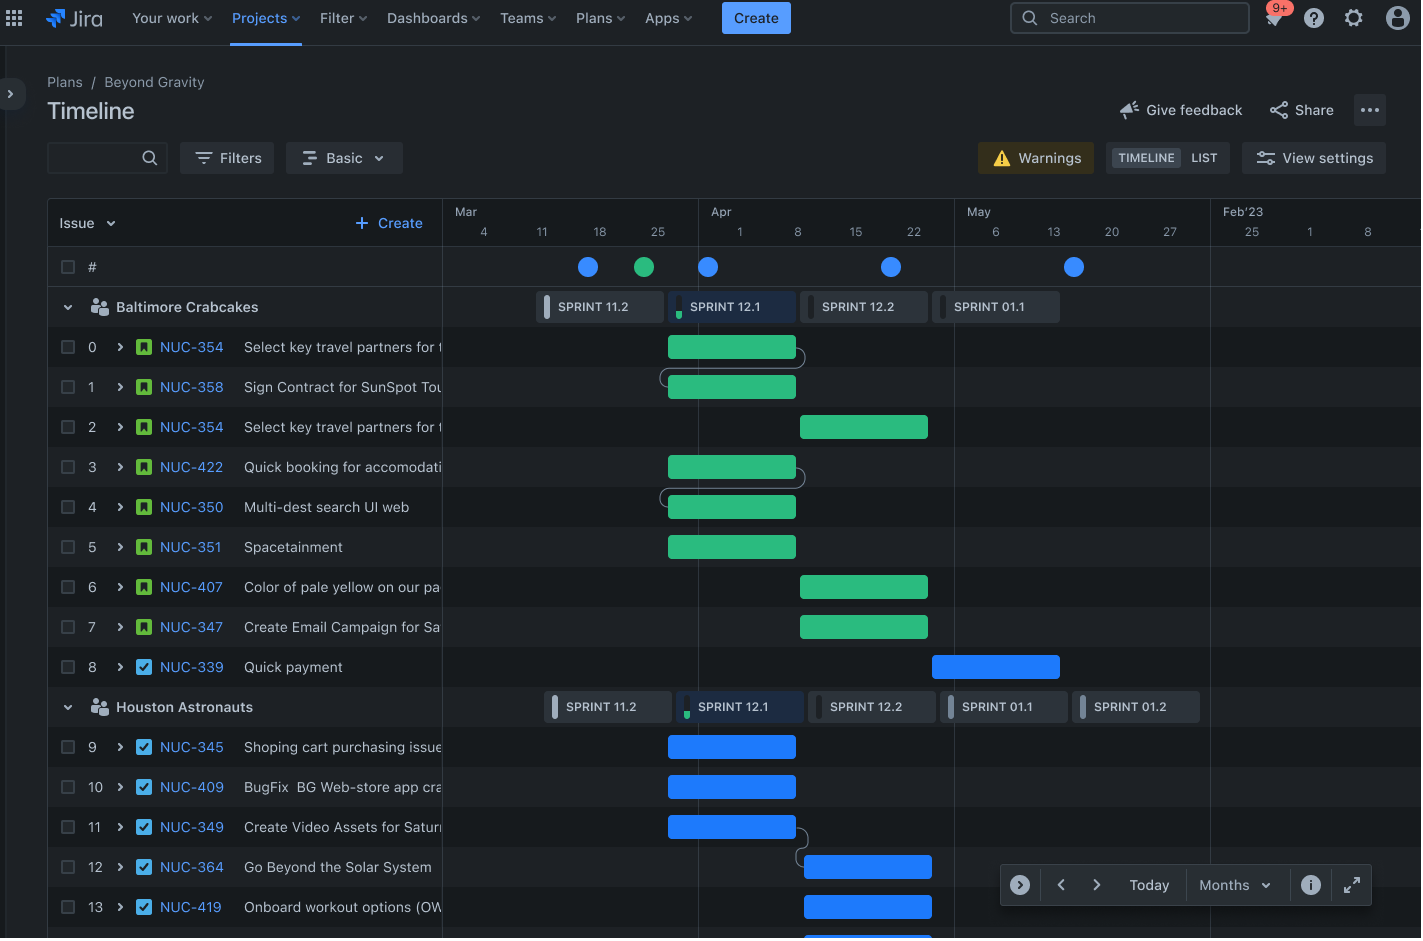
高级组织结构图:计划
Jira 的计划提供了快速、简便的规划,可帮助团队更好地管理其依赖关系,并跟踪全局的实时进度。这些项目或团队级别的路线图对于团队级别的大型工作规划非常有用。
若要跨多个团队甚至整个公司规划、管理和跟踪工作,可使用计划大规模增强团队的能力。
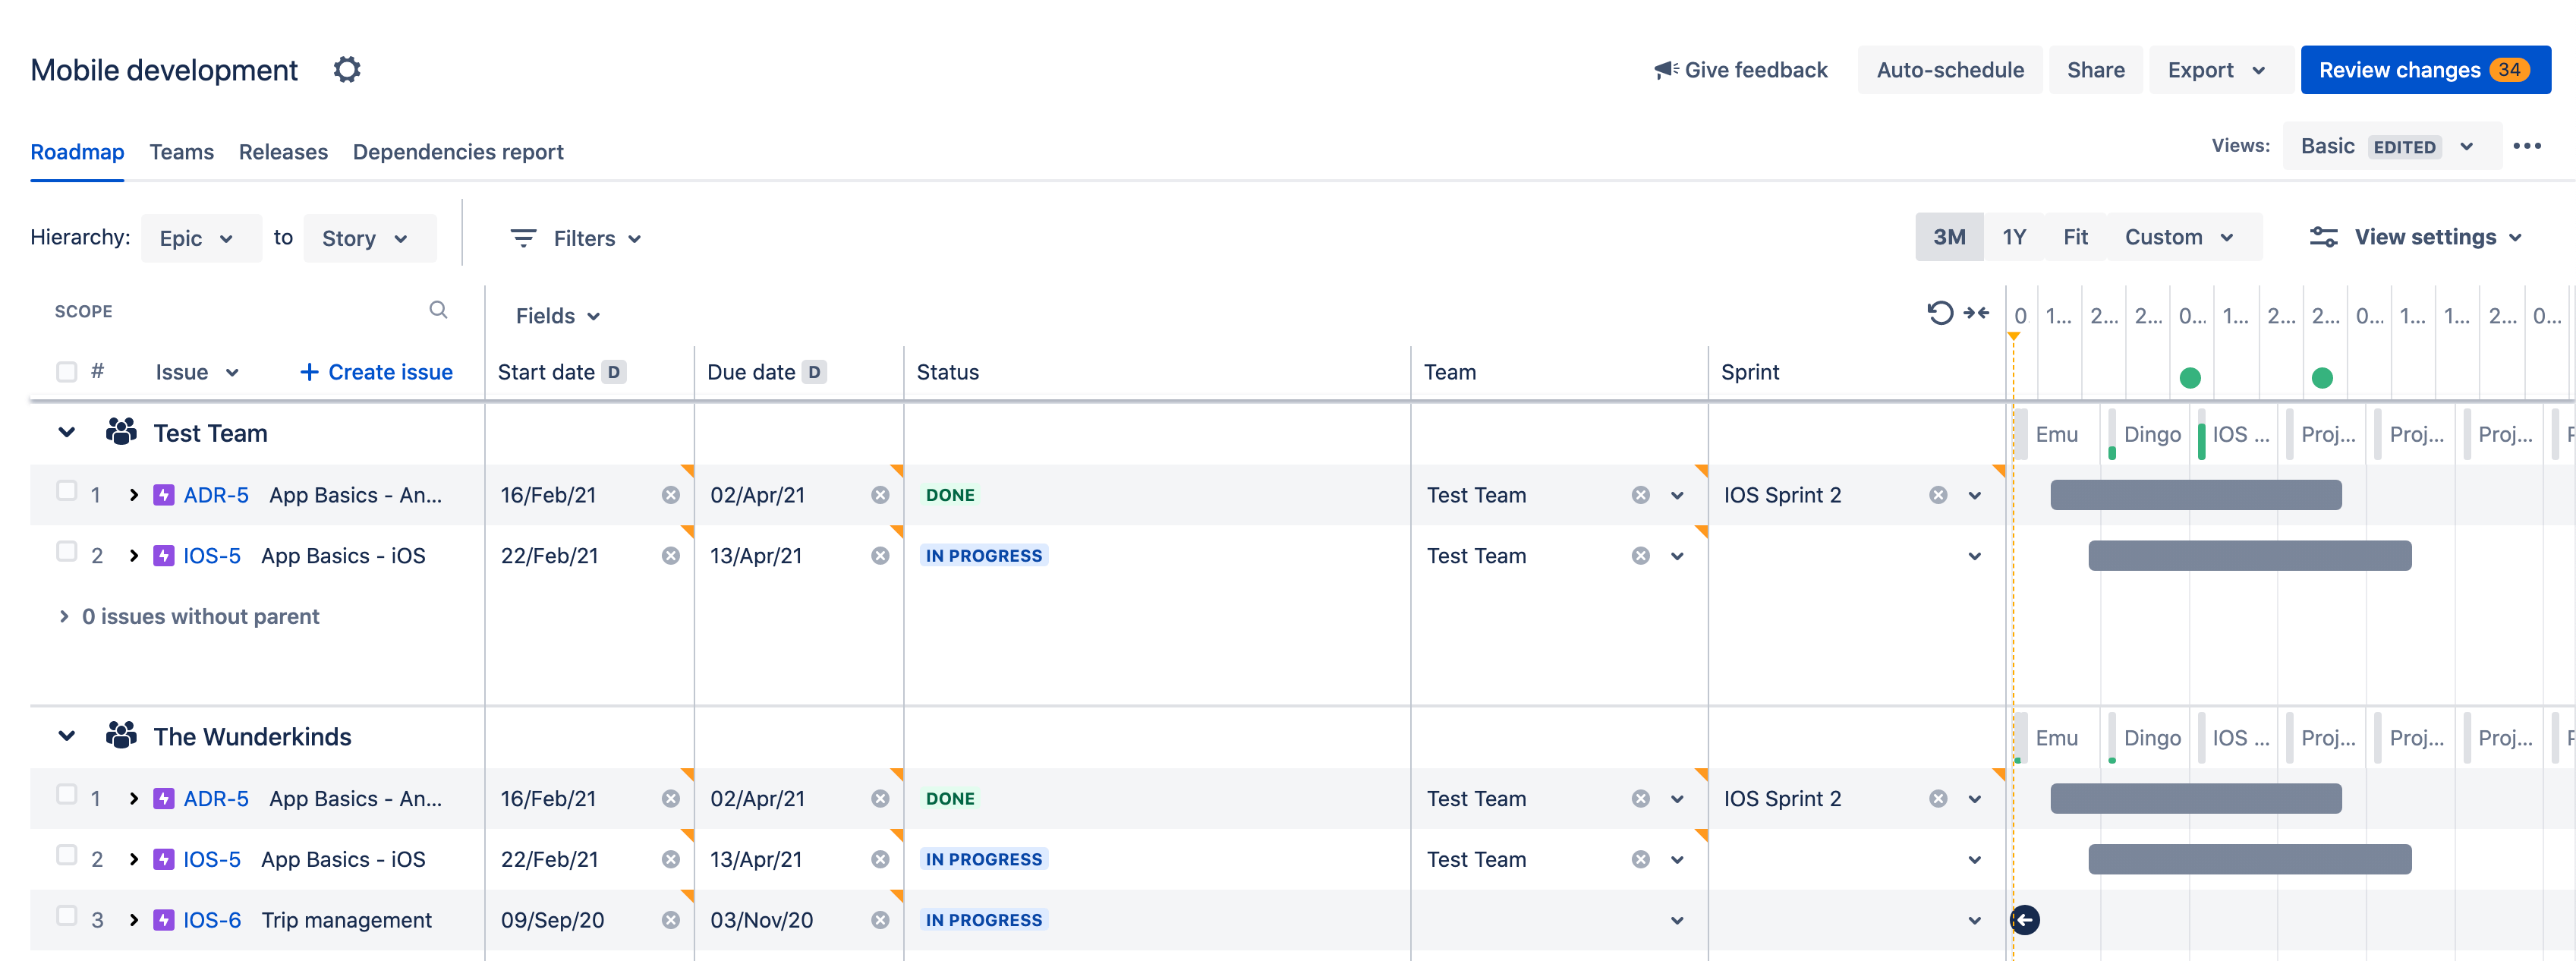
采用跨团队工作流设计的程序可提供更先进的工具,如产能管理和自动调度功能,以帮助创建更复杂的计划。它们还提供各种视图设置,让您可以自定义甘特图,以便在展示时突出计划的某个方面。
Elevate your project management with Jira's Gantt charts
Transform your project management approach with the power of Gantt charts in Jira. These visual timelines are not just about tracking tasks—they're about achieving your project goals precisely and clearly. By leveraging Jira's robust features, you can create Gantt charts that are efficient and pivotal in steering your projects toward success.
Jira seamlessly integrates with various Gantt chart tools, providing a holistic project tracking and management solution. This integration ensures that your project timelines are always up-to-date, allowing real-time adjustments and insights.
Harness the full potential of Jira's capabilities to manage your Gantt charts effectively. With real-time updates, customizable dashboards, and advanced reporting, Jira empowers you to keep your projects on track and your team aligned.
Are you ready to revolutionize your project management strategy?
相关资源