Agile professionals staan voor een gemeenschappelijke uitdaging: het meten en verbeteren van de productprestaties. Onduidelijkheid kan leiden tot verkeerd afgestemde prioriteiten, verspilde middelen en producten die niet voldoen aan de behoeften van de gebruikers.
Door zich te concentreren op de juiste prestatiestatistieken van producten, kunnen agile teams waardevolle inzichten verkrijgen in de prestaties van hun product, de betrokkenheid van de gebruikers en het algemene succes. Deze statistieken helpen teams bij het nemen van datagestuurde beslissingen en continue verbetering. Wanneer ze worden afgestemd op Agile statistieken, hebben deze inzichten nog meer impact.
In deze handleiding leer je wat productstatistieken zijn, waarom ze cruciaal zijn voor agile teams en welke essentiële statistieken agile professionals moeten bijhouden. Maak gebruik van Jira voor verbeterd productbeheer en het volgen van statistieken.
Wat zijn productstatistieken?
Productstatistieken zijn kwantificeerbare maatstaven waarmee teams de prestaties, het gebruik en het algehele succes van een product of functie kunnen beoordelen. Ze bieden waardevolle inzichten in het gedrag van klanten, de betrokkenheid van gebruikers en financiële resultaten. Met behulp van statistieken kunnen productmanagers en agile teams datagestuurde beslissingen nemen gedurende de hele levenscyclus van het product. Door je te concentreren op statistieken voor productbeheer, kun je je inspanningen afstemmen op strategische doelen.
Teams kunnen gebieden voor verbetering in het product of de service identificeren, de impact van nieuwe functies of wijzigingen meten en inzicht krijgen in de behoeften en voorkeuren van gebruikers. Ook kun je dankzij statistieken je inspanningen op het gebied van productontwikkeling afstemmen op doelen op basis van nauwkeurige productspecificaties.
Belangrijke productstatistieken voor succes
Agile professionals moeten zich concentreren op een kernset van statistieken die een volledig beeld geven van de gezondheid en impact van het product. Dit helpt bij het meten en verbeteren van de productprestaties.
Kosten voor klantenwerving (CAC)
Kosten voor klantenwerving zijn de totale kosten om een nieuwe klant te werven. Deze omvatten marketingkosten, salarissen van het salesteam en andere kosten in verband met het aantrekken en omzetten van potentiële klanten in betalende klanten. Door statistieken zoals CAC te volgen, kunnen agile teams de effectiviteit van hun marketing- en verkoopstrategieën beoordelen.
Een hoge CAC kan wijzen op de noodzaak van meer gerichte marketingstrategieën of verbeteringen in het waardevoorstel van het product.
Om de CAC te berekenen, deel je de totale kosten van verkoop en marketing door het aantal nieuwe klanten dat in een bepaald tijdsbestek is verworven. Als je bijvoorbeeld in een maand $ 10.000 uitgeeft aan marketing en verkoop en 100 nieuwe klanten verwerft, dan is je CAC $ 100.
Levenslange waarde van de klant (CLV)
Levenslange waarde van de klant (CLV) meet de totale inkomsten die een bedrijf kan verwachten van één enkele klant gedurende de hele relatie met het bedrijf. Met deze statistiek kunnen teams de waarde van hun klantrelaties op lange termijn beoordelen en weloverwogen beslissingen nemen over wervings- en behoudstrategieën. Door CLV te vergelijken met CAC kunnen agile teams bepalen of ze het juiste bedrag investeren in klantenwerving en -behoud.
Een gezonde verhouding tussen CLV en CAC geeft aan dat het product klanten waarde oplevert op lange termijn en duurzame inkomsten genereert voor het bedrijf. Schattingsmodellen die CLV gebruiken, kunnen helpen bij financiële planning en strategieontwikkeling.
Om de CLV te berekenen, vermenigvuldig je de gemiddelde aankoopwaarde met de gemiddelde aankoopfrequentie en de levensduur van de klant. Als een klant bijvoorbeeld $ 100 per maand uitgeeft, 12 keer per jaar aankopen doet en vijf jaar klant blijft, dan bedraagt zijn CLV $ 6.000.
Verlooppercentage
Het verlooppercentage vertegenwoordigt het percentage klanten dat gedurende een bepaalde periode stopt met het gebruik van je product of service. Deze statistiek is cruciaal om inzicht te krijgen in de klanttevredenheid en de algemene gezondheid van je bedrijf. Een hoog verlooppercentage kan wijzen op problemen met de kwaliteit van het product, de klantenservice of de algemene gebruikerservaring.
Agile teams kunnen problemen vroegtijdig identificeren door deze statistiek bij te houden en proactieve maatregelen te nemen om de klantbehoud te verbeteren. Het verminderen van het verloop kan kosteneffectiever zijn dan het werven van nieuwe klanten, waardoor deze statistiek bijzonder waardevol is voor duurzame groei.
Om het verlooppercentage te berekenen, deel je het aantal klanten dat tijdens een bepaalde periode verloren is gegaan door het totale aantal klanten aan het begin van die periode. Als je de maand bijvoorbeeld begon met 1.000 klanten en 50 klanten verloor, dan is je maandelijkse verlooppercentage 5%.
Maandelijks terugkerende inkomsten (MRR)
Maandelijks terugkerende inkomsten zijn een cruciale statistiek voor producten of services op basis van abonnementen. Het vertegenwoordigt de voorspelbare en terugkerende inkomsten die je klantenbestand elke maand genereert.
Door statistieken zoals MRR te volgen, kunnen agile teams inzicht krijgen in de financiële gezondheid en het groeitraject van hun product. Door veranderingen in de MRR in de loop van de tijd te volgen, kunnen teams beoordelen welke impact nieuwe functies, prijswijzigingen en inspanningen op het gebied van klantenbehoud hebben op het bedrijfsresultaat. Door deze inzichten af te stemmen op productroadmaps ontstaat er strategische groei.
Om de MRR te berekenen, vermenigvuldig je het totale aantal betalende klanten met de gemiddelde omzet per klant. Als je bijvoorbeeld 300 klanten hebt en elk van hen gemiddeld $ 75 per maand uitgeeft, dan is je MRR $ 22.500.
Activeringspercentage
Het activeringspercentage houdt het percentage gebruikers bij dat een specifieke reeks acties uitvoert die consistent zijn met het ervaren van de kernwaarde van je product. Deze statistiek is essentieel om te begrijpen hoe effectief je product nieuwe gebruikers aantrekt en zijn belofte waarmaakt. Een hoog activeringspercentage geeft aan dat gebruikers snel waarde vinden in je product, wat vaak leidt tot een hoger behoud en CLV.
Dankzij deze statistiek kunnen agile teams knelpunten in het onboardingproces van gebruikers identificeren en de initiële gebruikerservaring optimaliseren. Statistieken voor productbeheer zoals deze stimuleren de initiële gebruikersbetrokkenheid.
Om het activeringspercentage te berekenen, deel je het aantal gebruikers dat de gewenste acties heeft voltooid door het totale aantal nieuwe gebruikers gedurende een bepaalde periode. Als bijvoorbeeld 80 van de 100 nieuwe gebruikers je onboardingproces hebben voltooid en een belangrijke actie hebben uitgevoerd, zou je activeringspercentage 80% zijn.
Jira-borden kunnen het beheer van de levenscyclus van projecten ten goede komen door teams te helpen de activeringspercentages bij te houden en te verbeteren. Deze borden geven visueel het gebruikersproces weer, zodat teams de stappen die nodig zijn voor de activering in kaart kunnen brengen en de voortgang in realtime kunnen volgen.
Technieken voor effectieve analyse van productstatistieken
Agile professionals moeten effectieve rapportage- en analysetechnieken gebruiken om zinvolle inzichten te verkrijgen uit productstatistieken. Er volgen nu twee manieren waarop teams hun statistische gegevens kunnen maximaliseren.
Benchmarks en doelen stellen
Het vaststellen van duidelijke benchmarks en doelen is essentieel voor het contextualiseren van productstatistieken en het stimuleren van verbeteringen. Stel realistische doelen en stem ze af op je bedrijfsdoelstellingen. Een van de meest effectieve methoden om deze doelen te bereiken is het SMART-kader, dat staat voor specifiek, meetbaar, haalbaar, relevant en tijdsgebonden:
- Specifiek: in plaats van een vaag doel zoals "klanttevredenheid verhogen", moet je streven naar iets specifieks, zoals "de klanttevredenheid met 10% verhogen door betere supportservices".
- Meetbaar: stel duidelijke statistieken op om de voortgang mee aan te tonen. Als je bijvoorbeeld het verloop wilt verminderen, geef dan aan dat je ernaar streeft om het verlooppercentage in het volgende kwartaal te verlagen van 5% naar 3%.
- Haalbaar: stel uitdagende maar haalbare doelen. Houd rekening met je middelen, tijdsbeperkingen en teamcapaciteiten. Het is misschien onrealistisch om "het klantenbestand te verdubbelen" in een maand. Richt je in plaats daarvan op een stijging van 20% in zes maanden.
- Relevant: evalueer of het doel een fundamentele zakelijke behoefte aanpakt. Als het bijvoorbeeld je doel is om de bruikbaarheid van producten te verbeteren, zou een relevant doel kunnen zijn om de gemiddelde onboardingtijd voor nieuwe gebruikers met 25% te verkorten.
- Tijdgebonden: bepaal een specifiek tijdskader voor het bereiken van het doel. Zo kun je vooruitgang onderverdelen in kleinere mijlpalen. Bijvoorbeeld: "verhoog de maandelijkse terugkerende inkomsten met 15% in het volgende kwartaal".
Trends en patronen analyseren
Identificeer trends en patronen in de loop van de tijd om waardevolle inzichten te verkrijgen uit productstatistieken. Dit zijn enkele belangrijke technieken:
- Gebruik tools voor datavisualisatie. Grafieken, diagrammen en dashboards kunnen teams helpen om snel trends en afwijkingen in statistische gegevens te identificeren.
- Analyseer segmentgegevens. Deel de statistieken per gebruikersgroep, functie of periode om meer genuanceerde inzichten te verkrijgen.
- Zoek naar verbanden. Analyseer de relaties tussen verschillende statistieken om te begrijpen hoe ze elkaar beïnvloeden en de algemene productprestaties beïnvloeden.
- Maak gebruik van agile rapporten. Gebruik agile rapportagetools zoals sprint- of snelheidsgrafieken om de voortgang bij te houden en productstatistieken op een iteratieve, realtime manier te analyseren.
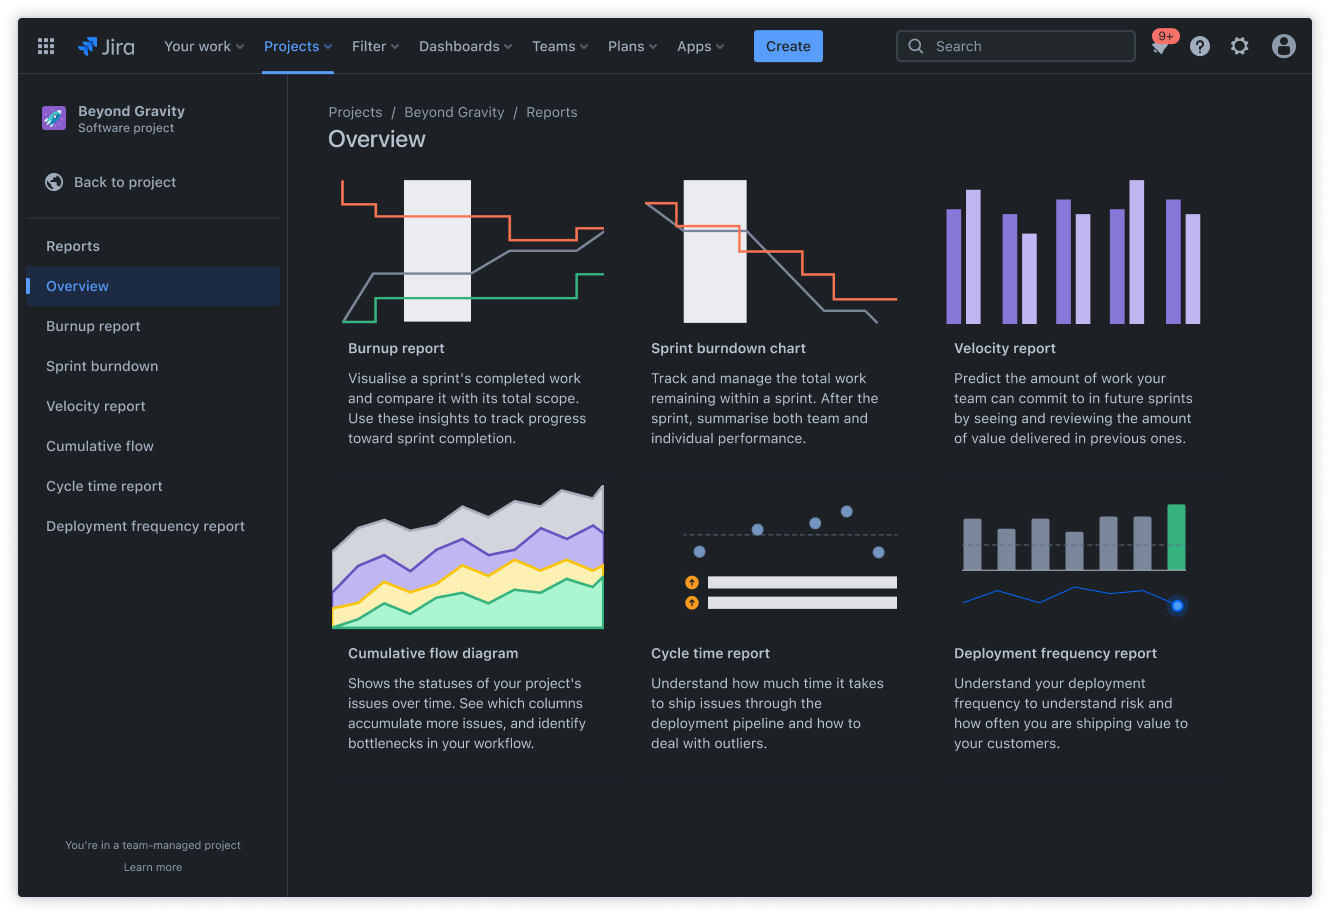
In Jira kun je bijvoorbeeld functies voor datavisualisatie en rapportage gebruiken om inzichten te vinden waarmee je strategische beslissingen kunt nemen. Met aanpasbare dashboards en rapporten kun je onbewerkte gegevens omzetten in duidelijke, visuele momentopnamen van de voortgang en prestaties van je project.
Gebruik Jira voor effectief productbeheer en het verbeteren van productstatistieken
Het beheren van productstatistieken zonder een speciale tool kan uitdagend en tijdrovend zijn. Spreadsheets worden onhandig, er ontstaan datasilo's en teams hebben moeite om effectief samen te werken. Deze chaos leidt tot gemiste kansen voor verbetering en zorgt voor tragere reacties op veranderende marktomstandigheden.
Het gebruik van productontwikkelingssoftware zoals Jira kan het beheer van de levenscyclus van producten vereenvoudigen. Door productgegevens te centraliseren, rapportage te automatiseren en samenwerking te vergemakkelijken, kan Jira het vermogen van een agile team om productstatistieken bij te houden en te verbeteren aanzienlijk verhogen.
Hier zijn enkele belangrijke functies van Jira die kunnen helpen om de productstatistieken te verbeteren:
- Visualiseer je workflow. Maak aangepaste borden die rechtstreeks op je productontwikkelingsproces zijn afgestemd, zodat je de voortgang kunt volgen en knelpunten kunt identificeren.
- Verbeter de samenwerking. Gebruik de functies voor reacties en @-vermeldingen om discussies over statistieken en verbeteringsstrategieën mogelijk te maken.
- Houd iteraties bij. Gebruik functies voor sprintplanning om statistische doelen voor elke ontwikkelingscyclus vast te stellen en bij te houden.
- Automatiseer de rapportage. Stel aangepaste dashboards en rapporten in om productstatistieken in realtime bij te houden. Dit bespaart tijd en zorgt ervoor dat iedereen toegang heeft tot de meest recente gegevens.
- Integreer met andere tools. Koppel andere tools voor analyse en klantfeedback om een uitgebreid beeld te krijgen van de productprestaties.
Met Jira kun je productbeheer op een meer datagestuurde manier benaderen. Dit leidt tot betere besluitvorming en betere productprestaties.