Wat is een Gantt-grafiek? Belangrijkste functies en voordelen met handige sjablonen
Een Gantt-diagram is een visuele tijdlijn voor het volgen van taken en mijlpalen gedurende de levenscyclus van een project.

Aan de slag met de gratis Gantt-diagramsjabloon
Wil je de projectefficiëntie verhogen? Gebruik deze sjabloon om tijdlijnen, taken en resources visueel te plannen, in te plannen en te beheren voor een naadloze samenwerking.
Belangrijke leerpunten
Een Gantt-diagram is een visuele projectbeheertool die taken, tijdlijnen, afhankelijkheden en mijlpalen in kaart brengt voor effectieve planning en tracking.
Het vereenvoudigt complexe planning, verbetert de toewijzing van middelen en biedt een overzicht op hoog niveau voor alle belanghebbenden.
Belangrijke componenten zijn onder meer takenlijsten, tijdlijnen, afhankelijkheden en mijlpalen, ter ondersteuning van samenwerking en voortgangsbewaking.
Maak een Gantt-diagram aan voor je volgende project om de zichtbaarheid en coördinatie te verbeteren en een tijdige levering te garanderen.
Ben je op zoek naar een overzicht op hoog niveau van projectplanningen of een eenvoudigere manier om complexe plannen te beheren waarbij meerdere teams en verschuivende deadlines betrokken zijn?
Het is tijd om een aangepast Gantt-diagram te overwegen.
Met deze visie kunnen projectmanagers en teams georganiseerd en gefocust blijven op het bereiken van hun doelen, samen en niet in silo's. Een aanpasbaar Gantt-diagram werkt ook als een tijdlijn in de projectlevenscyclus.
Dit biedt je de mogelijkheid om taken en mijlpalen bij te houden en de voortgang te delen met belanghebbenden. Of je nu sprints of langetermijnprojecten beheert, in deze uitgebreide handleiding wordt uitgelegd wat Gantt-diagrammen zijn, evenals de praktische toepassingen, voordelen en een gratis sjabloon om je nu op weg te helpen.
Wat is een Gantt-grafiek?
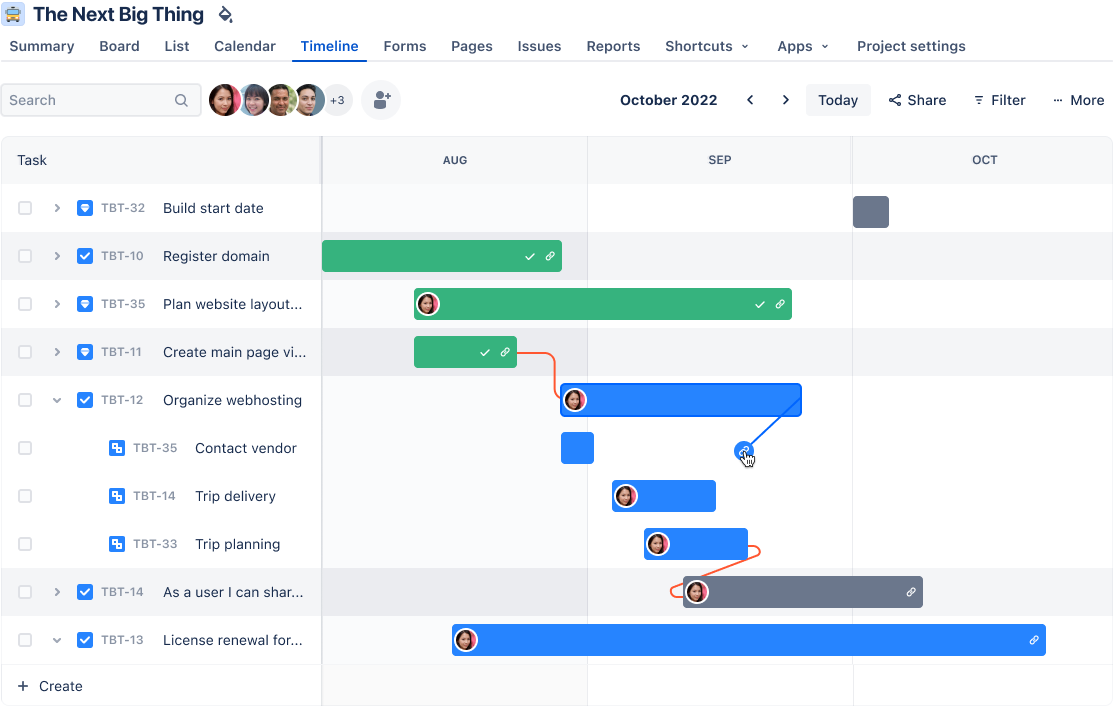
Een Gantt-grafiek is een agile tool voor projectbeheer die wordt gebruikt voor het plannen en bijhouden van verschillende taken en activiteiten binnen een project. Hij fungeert als een zichtbare tijdlijn die de lijst met taken toont, hun begin- en einddatum, mijlpalen, en de afhankelijkheden tussen taken en uitvoerders.
Een Gantt-diagram is een waardevolle roadmap die teams en organisaties helpt bij het effectief plannen en coördineren van hun werkitems. Door de onderlinge verbanden tussen taken te illustreren, bevordert het een naadloze samenwerking en afstemming tussen de belanghebbenden van het project.
Een goed gedefinieerd en visueel duidelijk Gantt-diagram zorgt ervoor dat alle neuzen dezelfde kant op wijzen en iedereen aan hetzelfde doel werkt.
De geschiedenis van Gantt-grafieken
Gantt-grafieken zijn bedacht door Henry Gantt, een Amerikaans werktuigbouwkundig ingenieur die deze visuele projectmanagementtechniek ontwikkelde in de vroege jaren 1910. Ze zijn oorspronkelijk ontworpen voor productie- en bouwprojecten, werden met de hand op papier getekend en moesten handmatig worden bijgewerkt wanneer projecttijdlijnen veranderden.
In de loop van de decennia heeft dit eenvoudige maar effectieve hulpmiddel een aanzienlijke evolutie ondergaan. Wat begon als statische papieren grafieken, is veranderd in dynamische, op software gebaseerde oplossingen.
Makers van moderne Gantt-grafieken bieden nu realtime samenwerking, geautomatiseerde updates en integratie met andere tools voor projectbeheer, waardoor ze onmisbaar zijn voor complexe projecten.
Belangrijkste functies van software voor Gantt-diagrammen
Gantt-grafieken bestaan meestal uit twee delen: links een overzicht van taken en rechts een projecttijdlijn met planningsbalken die werk visualiseren. Laten we de belangrijkste componenten van een Gantt-grafiek eens nader bekijken.
Tijdlijn
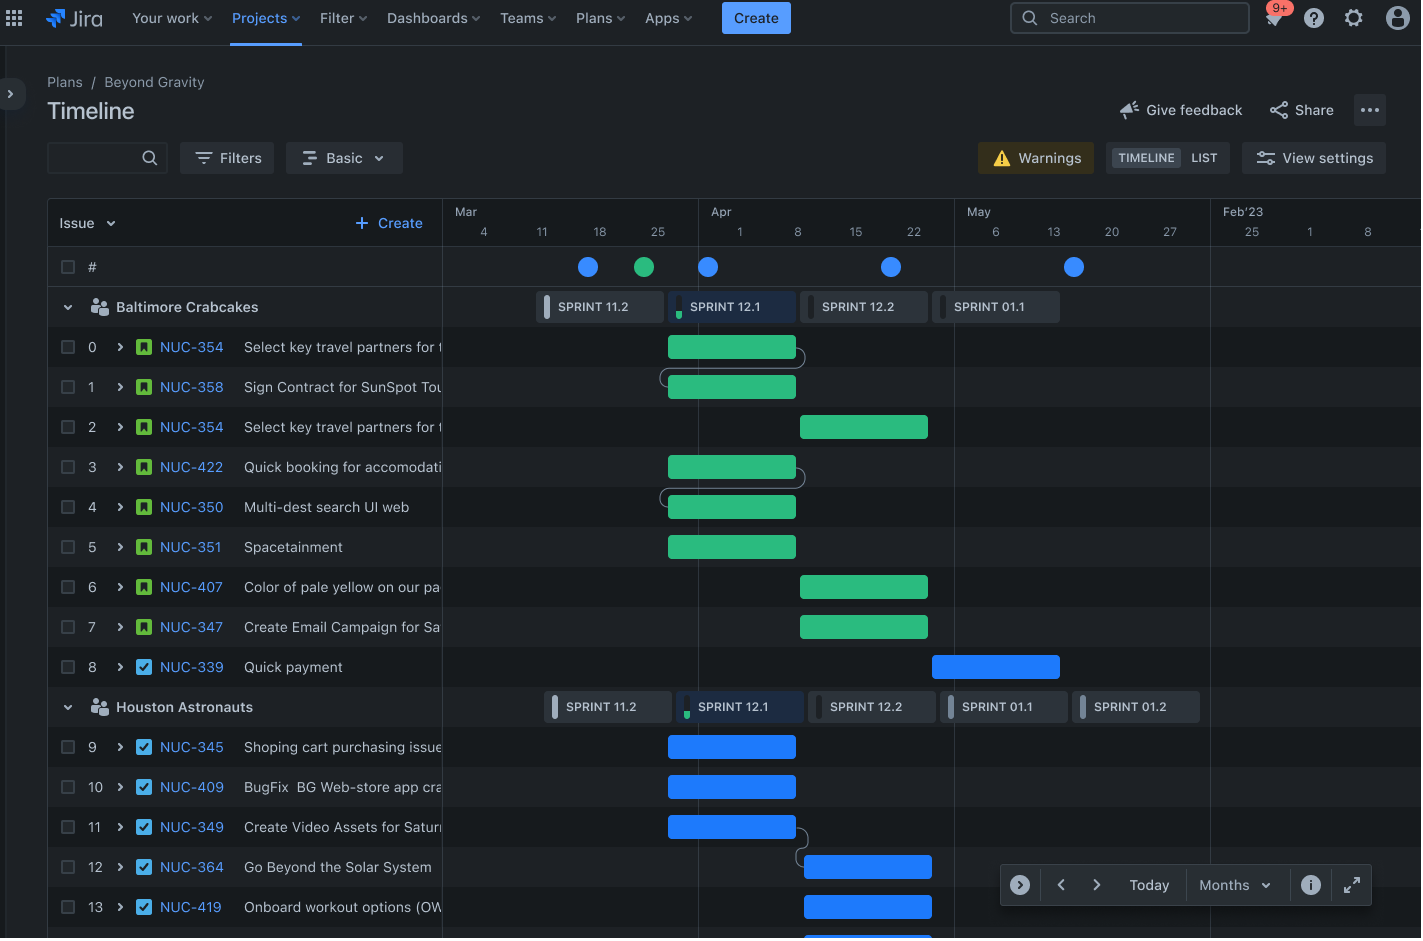
De tijdlijn is een visuele weergave van de projectplanning, met de begin- en einddatums bovenaan de grafiek. Hij biedt een duidelijk overzicht van je projectplanning, zodat je de volgorde en de duur van taken kunt visualiseren.
Met tijdlijnen kun je potentiële knelpunten identificeren en proactieve aanpassingen mogelijk maken om het project op schema te houden. Een marketingteam gebruikt de tijdlijn bijvoorbeeld om een productlancering te plannen, waarbij ervoor wordt gezorgd dat alle promotieactiviteiten op elkaar zijn afgestemd en op tijd worden uitgevoerd.
Afhankelijkheden
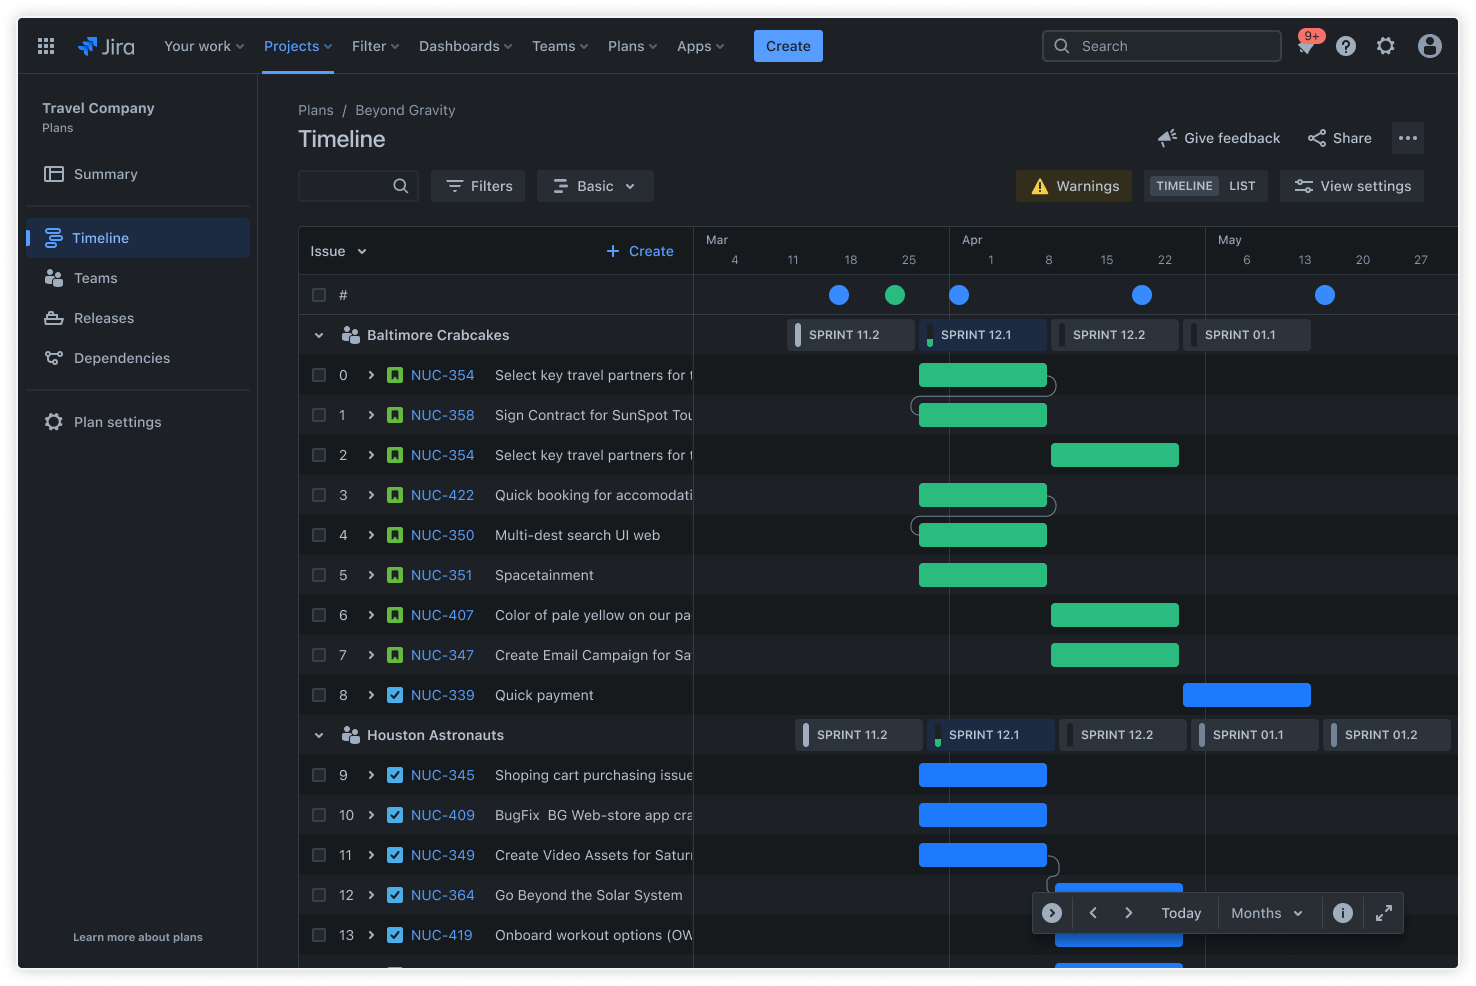
De verbanden tussen taken bepalen de volgorde van de operations en laten zien hoe taken met elkaar samenhangen. Met Geavanceerde planning stel je afhankelijkheden tussen taken in om te zorgen dat ze in de juiste volgorde worden voltooid.
Tegelijkertijd moet een roadmap automatisch de planningen aanpassen wanneer wijzigingen optreden. Dit voorkomt vertragingen door te zorgen dat de vereiste taken zijn voltooid voordat de afhankelijke taken beginnen. Een bouwproject heeft bijvoorbeeld afhankelijkheden om te zorgen dat de funderingswerkzaamheden zijn voltooid voordat de structuur wordt opgesteld.
Toewijzing van middelen

Deel grote projecten en grote hoeveelheden werk op in kleinere, beheersbare stukken die werkitems worden genoemd. Gebruik werkitems om taakinformatie en statusupdates vast te leggen, zodat het hele team op de hoogte blijft.
Effectief resourcebeheer zorgt dat teamleden niet overbelast raken en dat vaardigheden op de juiste manier worden afgestemd op taken.
Lijst
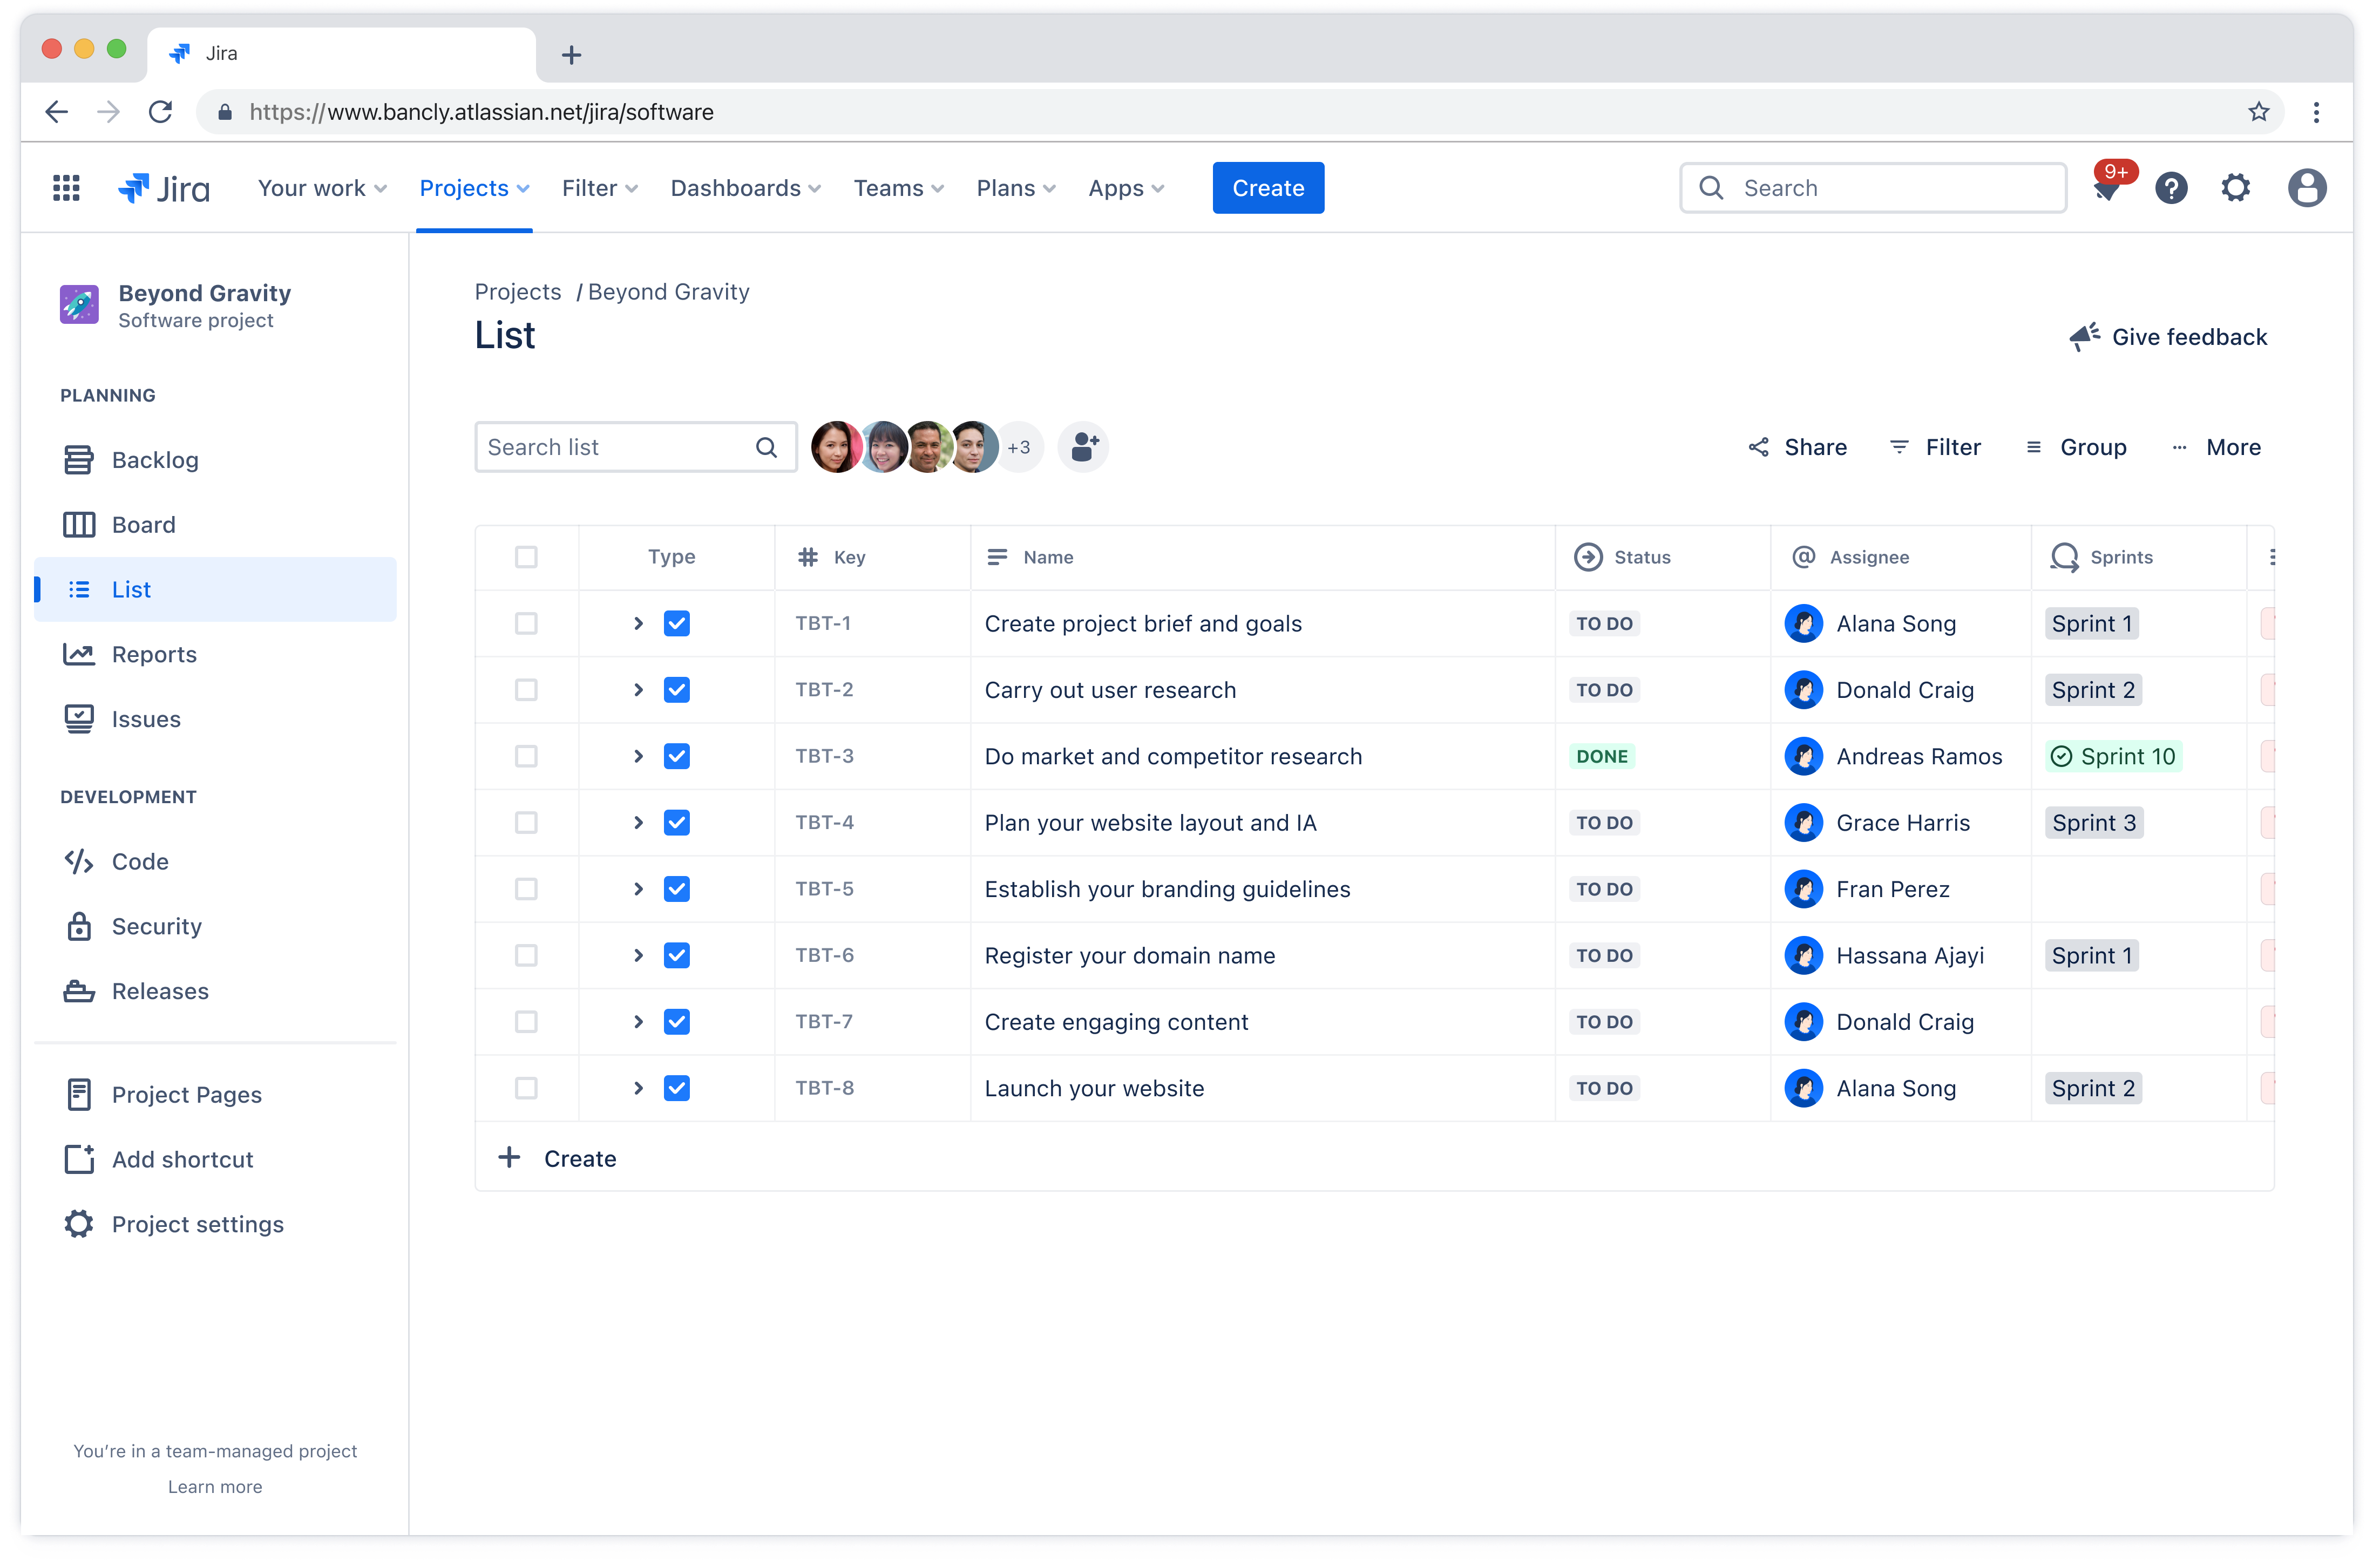
Een takenlijst is een uitgebreide lijst van alle taken die nodig zijn om het project te voltooien. Met projectbeheersoftware kunnen taken worden aangemaakt en beheerd met behulp van de werkitemtracker.
Hiermee kun je taken toewijzen aan teamleden, prioriteiten stellen en de voortgang bijhouden. Elk teamlid zal zich bewust zijn van zijn verantwoordelijkheden en deadlines, wat de verantwoordelijkheid en efficiëntie bevordert.
Een softwareontwikkelingsteam gebruikt de takenlijst bijvoorbeeld om coderings-, test- en implementatietaken toe te wijzen aan verschillende ontwikkelaars, wat zorgt voor een soepele workflow.
Mijlpalen
Projectmijlpalen in Gantt-grafieken zijn markeringen op de projecttijdlijn die grote voortgang of voltooiing van de projectfasen aangeven. Met de juiste tools kun je belangrijke mijlpalen markeren met mijlpaalmarkeringen, zodat je team zich kan concentreren op kritieke deadlines en prestaties.
Mijlpalen zorgen voor motivatie en een gevoel van voldoening, waardoor teams zich kunnen blijven concentreren op langetermijndoelen. Een productontwikkelingsteam stelt bijvoorbeeld een mijlpaal voor de voltooiing van de prototypefase, wat aangeeft dat het gereed is voor gebruikerstesten.
Voor- en nadelen van het gebruik van Gantt-diagrammen
Zoals elke tool voor projectbeheer hebben Gantt-grafieken duidelijke voordelen en beperkingen waarmee teams rekening moeten houden.
Belangrijkste voordelen van Gantt-grafieken
Visuele duidelijkheid: Teams kunnen in één oogopslag de voortgang van het project, naderende deadlines en taakrelaties zien.
Verbeterde planning: De visuele vorm maakt het eenvoudiger om potentiële conflicten te herkennen en hier omheen te plannen.
Verbeterde communicatie: Belanghebbenden kunnen snel inzicht krijgen in de projectstatus, zonder in gedetailleerde rapporten te hoeven duiken.
Beter tijdbeheer: Duidelijke tijdlijnen helpen teams om gefocust te blijven op prioriteiten.
Opmerkelijke beperkingen van Gantt-grafieken
Complexiteit in grote projecten: Sjablonen voor Gantt-grafieken kunnen overweldigend worden bij het beheren van honderden taken.
Onderhoudsvereisten: Regelmatige updates zijn essentieel om te zorgen dat de grafieken kloppend en bruikbaar blijven.
Leercurve: Bepaalde teamleden hebben mogelijk training nodig om de grafieken effectief te kunnen aflezen en bijwerken.
Wanneer je Gantt-diagrammen moet gebruiken (en wanneer niet)
Gantt-diagrammen blinken uit in specifieke scenario's, maar ze zijn niet altijd de beste keuze voor elk projecttype.
Ideale use cases zijn:
Grote projecten op basis van een tijdlijn: Wanneer de uitvoering van een project meerdere fasen en afhankelijkheden omvat.
Multidisciplinaire initiatieven: Projecten die coördinatie vereisen tussen verschillende afdelingen of teams.
Klantgericht werken: Wanneer belanghebbenden een duidelijk zicht moeten hebben op de voortgang van het project en de deliverables.
Hoewel Gantt-grafieken krachtige visualisatiemogelijkheden bieden, kunnen ze soms leiden tot onnodige complexiteit voor eenvoudigere workflows. Overweeg eenvoudigere alternatieven bij:
Het beheren van kleine, flexibele projecten: Agile sprints hebben mogelijk meer baat bij Kanban-borden.
Het werken met vaak veranderende vereisten: Statische grafieken kunnen snel verouderd raken.
Het leiden van creatieve projecten: Waar het proces meer verkennend dan lineair is.

Wie zou Gantt-diagrammen moeten gebruiken?
Gantt-grafieken zijn niet alleen voor projectmanagers. Ze zijn waardevolle hulpmiddelen voor iedereen die complexe werkzaamheden moet coördineren over een lange tijd en tussen diverse teams. De rollen die het meest profiteren van Gantt-grafieken zijn:
Projectmanagers: Projectmanagers gebruiken deze grafieken voor een compleet overzicht en de strategische planning van meerdere initiatieven. De visuele vorm stelt ze in staat om potentiële conflicten tussen projecten te herkennen, middelen effectief toe te wijzen en de voortgang in één oogopslag duidelijk te maken aan belanghebbenden.
Teamleiders: Teamleiders gebruiken Gantt-grafieken om het werk binnen hun afdelingen of functionele gebieden te coördineren. Ze kunnen precies zien wanneer hun teamleden beschikbaar zijn, potentiële knelpunten herkennen voordat ze zich voordoen, en zorgen dat deliverables worden afgestemd op bredere projecttijdlijnen.
Operationeel directeurs: Operationeel directeurs gebruiken Gantt-grafieken om terugkerende processen te beheren en het beheer van resources in hun hele organisatie te optimaliseren. In tegenstelling tot projectmatig werken, omvat hun werk vaak cyclische activiteiten die zorgvuldige coördinatie vereisen om efficiënt te blijven.
Houd er rekening mee dat industriële toepassingen aanzienlijk variëren. Bouwteams maken bijvoorbeeld veel gebruik van Gantt-grafieken om transacties te coördineren en de levering van materiaal te beheren, zodat beton wordt gestort nadat de bekistingen zijn geplaatst en de elektra pas wordt aangelegd nadat de ruwbouw is voltooid.
Softwareontwikkelingsteams hebben Gantt-grafieken aangepast voor releaseplanning en functieontwikkeling, waarbij ze vaak worden geïntegreerd in agile methodologieën om de sprintplanning over langere tijdsperioden te visualiseren.
Een Gantt-diagram maken
Laten we, met de voordelen van Gantt-diagrammen in het achterhoofd eens kijken hoe je je projectplannen kunt vertalen in een duidelijk en bruikbaar diagram. We behandelen de essentiële stappen, van het bepalen van de scope van je werk tot het bijhouden van de voortgang, om ervoor te zorgen dat je Gantt-diagram een waardevol hulpmiddel wordt voor een succesvolle projectuitvoering.
Je hebt twee opties om aan de slag te gaan: maak je Gantt-diagram vanaf het begin door de onderstaande stappen te volgen, of ga meteen aan de slag met onze gratis sjabloon, die vooraf gemaakte secties en voorbeelden bevat om je bij de installatie te begeleiden.
Haal de gratis sjabloon voor Gantt-grafieken op
Stap 1: Definieer de scope van het project
De eerste stap bij het maken van een Gantt-diagram is het bepalen van de projectscope. Begin met het vaststellen van de belangrijkste doelstellingen van het project. Duidelijke doelstellingen dienen als leidraad voor het project en zorgen ervoor dat alle taken gedurende de hele levenscyclus van het project op deze doelen aansluiten.
Nadat je de projectdoelstellingen hebt bepaald, beschrijf je de belangrijkste deliverables. Dit zijn de tastbare resultaten die je tijdens het hele project moet bereiken. Confluence biedt een sjabloon voor projectplanning die is ontworpen om je projectbeheerproces te stroomlijnen.
Deze begeleidt je bij de eerste stap van het definiëren van je projectscope en planning met duidelijke mijlpalen. Nadat je projectplan is opgesteld, kun je naadloos overgaan op het aanmaken van taken voor elke mijlpaal en elk product, wat zorgt voor een gestructureerde en efficiënte workflow.
Stap 2: Maak een lijst van alle taken en subtaken
Maak vervolgens een lijst van alle taken die nodig zijn om elk product te voltooien. Verdeel grote taken in kleinere subtaken om duidelijk te laten zien wat je team moet doen. Bekijk elke afzonderlijke taak, het teamlid dat ervoor verantwoordelijk is en de middelen die elke taak vereist.
Het gebruik van werkitems in Jira is een effectieve manier om deze taken aan te maken en te organiseren binnen de structuur van je Gantt-grafiek. Elk werkitem kan een specifieke taak of subtaak vertegenwoordigen, zodat je teamleden kunt toewijzen, prioriteiten kunt stellen en de voortgang kunt volgen, direct in je projecttijdlijn.
Pro-tip: Rovo integreert met Jira en Confluence om je projectplannen naadloos om te zetten in gedetailleerde taken binnen Jira, waardoor je workflow wordt gestroomlijnd en de productiviteit wordt verhoogd. Ontdek vandaag nog hoe Rovo je projectplannen omzet in uitvoerbare Jira-tickets!
Stap 3: Schat de duur van de taak in
Bepaal hoelang het duurt voordat elke taak is voltooid. Wees realistisch en houd rekening met mogelijke vertragingen. Neem buffertijd op in je planning om onverwachte vertragingen op te vangen en ervoor te zorgen dat het project op schema blijft.
Stap 4: Bepaal de taakafhankelijkheden
Identificeer de taakvolgorde. Sommige taken kunnen pas beginnen als andere zijn voltooid. Gebruik afhankelijkheidstypen zoals finish-to-start of start-to-start om relaties tussen taken te definiëren.
Met Geavanceerde planningen van Jira, genaamd Plannen, kunnen teams uitgebreide projectroadmaps maken die taakverbanden visualiseren en automatisch tijdlijnen aanpassen wanneer er wijzigingen plaatsvinden. Dit zorgt ervoor dat je Gantt-diagram nauwkeurig blijft naarmate je project evolueert.
Stap 5: Kies een tool voor Gantt-diagrammen
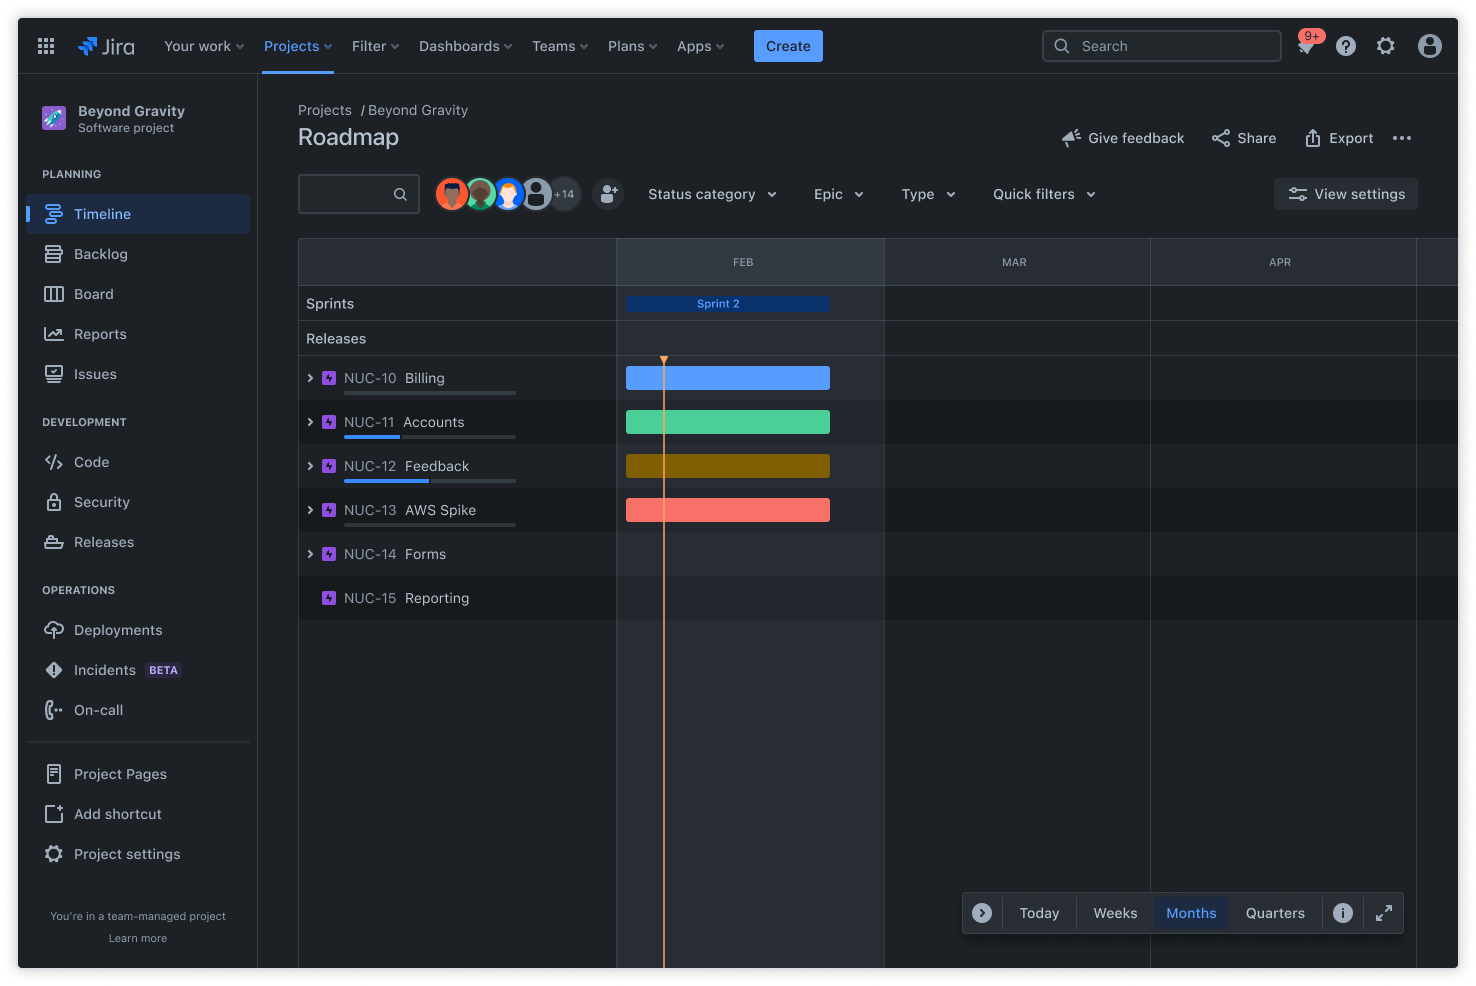
Wanneer je een tool voor Gantt-diagrammen kiest, moet je verschillende belangrijke factoren overwegen om er zeker van te zijn dat de tool voldoet aan de specifieke behoeften van je project.
Jira is een uitstekende optie voor het aanmaken van Gantt-diagrammen, met name voor software- en marketingteams. Tools zoals tijdlijnen en plannen helpen je om geavanceerde planningen te maken. Deze functies ondersteunen gedetailleerd taakbeheer, het bijhouden van afhankelijkheden en de toewijzing van middelen. Je kunt zelfs een sjabloon voor Gantt-diagrammen gebruiken om het proces te stroomlijnen.
Probeer de gratis Gantt-grafieksoftware
Stap 6: Voer gegevens in
Met Jira is het niet nodig om handmatig gegevens in een Gantt-grafiek in te voeren. Nadat je taken hebt gemaakt op basis van je projectplan, kun je moeiteloos overschakelen naar een tijdlijnweergave of Geavanceerde planningen van Jira gebruiken voor een weergave als een Gantt-grafiek.
Deze functie geeft automatisch de taakduur, afhankelijkheden en belangrijke mijlpalen weer, zodat je projecttijdlijn altijd up-to-date en nauwkeurig wordt gevisualiseerd.
Stroomlijn je projecten met Gantt-diagrammen in Jira
Jira verbetert de projectplanning en -uitvoering met zijn krachtige tijdlijnvisualisatie en robuuste mogelijkheden voor het volgen van werk. De dynamische tijdlijnfunctie in Jira werkt grafieken automatisch bij om wijzigingen in taken, datums en afhankelijkheden weer te geven, zodat je projectplan altijd actueel is.
Met Geavanceerde planning krijg je een overzicht op portfolioniveau, perfect voor het beheren van complexe initiatieven met meerdere teams. Deze functie gaat verder dan eenvoudige taakvolgorde door automatisch de impact van wijzigingen op je hele projecttijdlijn te berekenen, waarbij wordt aangegeven welke taken worden beïnvloed door vertragingen.
Confluence is een aanvulling op Jira door je workflow voor projectbeheer en de implementatie van je tijdlijn te verbeteren. Hoewel Jira uitblinkt in uitvoering en tracking, fungeert Confluence als je centrale hub voor projectdocumentatie, het verzamelen van vereisten en communicatie met belanghebbenden.
Je kunt live tijdlijnen van Jira rechtstreeks in Confluence-pagina's integreren en zo uitgebreide projectdashboards maken die visuele planningen combineren met gedetailleerde projectcontext, notulen en statusrapporten.
Gantt Chart Frequently Asked Questions
What is the main purpose of a Gantt chart?
A Gantt chart is a visual timeline used to plan, schedule, and track tasks and milestones throughout a project's lifecycle. It helps teams coordinate work, manage dependencies, and communicate progress.
What are the 7 important elements of a Gantt chart?
Key elements of a Gantt chart include the timeline, task list, dependencies, resource allocation, milestones, progress tracking, and assignees. These components provide a comprehensive view of project status and responsibilities.
What are common mistakes when making a Gantt chart?
Common mistakes include overcomplicating the chart, failing to update it regularly, not accounting for dependencies, and underestimating task durations. These issues can lead to confusion and project delays.
What are the 5 steps to building a Gantt chart?
The five steps are: define the project scope, list all tasks and subtasks, estimate task durations, determine task dependencies, and choose a Gantt chart tool to visualize and manage the schedule.
Voor jou aanbevolen
Sjablonen
Jira-sjablonen, klaar voor gebruik
Bekijk onze bibliotheek met op maat gemaakte Jira-sjablonen voor verschillende teams, afdelingen en workflows.
Producthandleiding
Een uitgebreide introductie tot Jira
Maximaliseer je productiviteit met de essentiële functies en de beste werkwijzen uit deze stapsgewijze handleiding.
Git-handleiding
De Git-basics onder de knie krijgen
Gebruik de tutorials en tips in deze Git-handleiding om de basis te leren. Handig voor iedereen: van beginners tot experts.