Что такое диаграмма Ганта? Основные возможности и преимущества с полезными шаблонами
Диаграмма Ганта — это визуализация хронологии, предназначенная для отслеживания задач и контрольных точек на протяжении жизненного цикла проекта.

Начните работу с бесплатным шаблоном диаграммы Ганта
Нужно повысить эффективность проекта? Используйте этот шаблон для визуального планирования, создания расписаний, а также управления сроками, задачами и ресурсами, чтобы оптимизировать совместную работу.
Основные моменты
Диаграмма Ганта — это визуальный инструмент управления проектами, который отображает задачи, сроки, зависимости и контрольные точки для эффективного планирования и отслеживания.
Диаграммы Ганта упрощают сложное планирование, улучшают распределение ресурсов и обеспечивают общий обзор для всех заинтересованных сторон.
Ключевые компоненты включают списки задач, сроки, зависимости и контрольные точки, поддерживающие совместную работу и мониторинг прогресса.
Создайте диаграмму Ганта для своего следующего проекта, чтобы повысить доступность информации, улучшить координацию работы и обеспечить своевременную реализацию вашей идеи.
Хотите получить общее представление о расписаниях проекта или упростить управление сложными планами, рассчитанными на несколько команд и изменение сроков?
Подумайте о создании собственной диаграммы Ганта.
Это представление позволяет менеджерам проектов и командам поддерживать порядок и уверенно идти к своим целям вместе, а не порознь. Персонализированная диаграмма Ганта также отражает хронологию жизненного цикла проекта.
Она дает вам возможность отслеживать задачи и контрольные точки, а также делиться информацией о ходе работ с заинтересованными сторонами. Независимо от того, управляете вы спринтами или долгосрочными проектами, из этого исчерпывающего руководства вы узнаете, что такое диаграммы Ганта, как они применяются на практике и каковы их преимущества, а также получите бесплатный шаблон, чтобы сразу начать работу.
Что такое диаграмма Ганта?
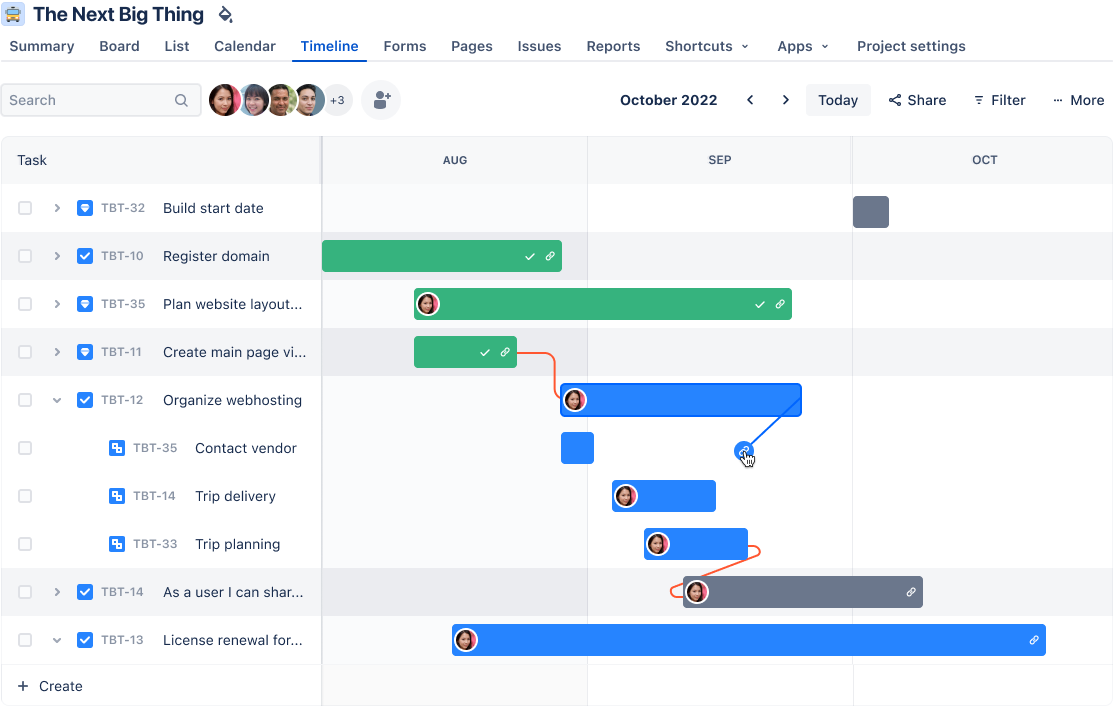
Диаграмма Ганта — это инструмент управления проектами по методике Agile, помогающий планировать и отслеживать прогресс самых разных задач и действий в рамках проекта. По сути, это визуальная хронология, в которой отображаются все задачи, даты их начала и окончания, контрольные точки, зависимости и исполнители.
Диаграмма Ганта может выступить в качестве ценной дорожной карты, помогающей командам и организациям грамотно планировать и координировать свои действия. На ней сразу видны взаимосвязи между задачами, а это значит, что все участники проекта могут тесно сотрудничать между собой, направляя усилия в единое русло.
Продуманная, наглядная и понятная диаграмма Ганта гарантирует согласованную работу всех участников для достижения общей цели.
История диаграмм Ганта
Формат диаграмм Ганта придуман Генри Гантом, американским инженером-машиностроителем, который разработал эту визуальную технику управления проектами в начале 1910-х годов. Изначально они были созданы для производственных и строительных проектов, диаграммы рисовались от руки на бумаге и при изменении сроков реализации проекта требовали обновления вручную.
За прошедшие десятилетия этот простой, но эффективный инструмент получил значительное развитие. То, что начиналось как статичные диаграммы на бумаге, превратилось в динамичные программные решения.
В современных диаграммах Ганта возможна совместная работа в реальном времени, автоматическое обновление и интеграция с другими инструментами управления проектами, что делает их незаменимыми для комплексных проектов.
Ключевые функции программ для построения диаграмм Ганта
Как правило, диаграммы Ганта состоят из двух частей: в левой отображается список задач, а в правой — хронология проекта с полосками сроков для визуализации работы. Остановимся подробнее на основных компонентах диаграммы Ганта.
Хронология
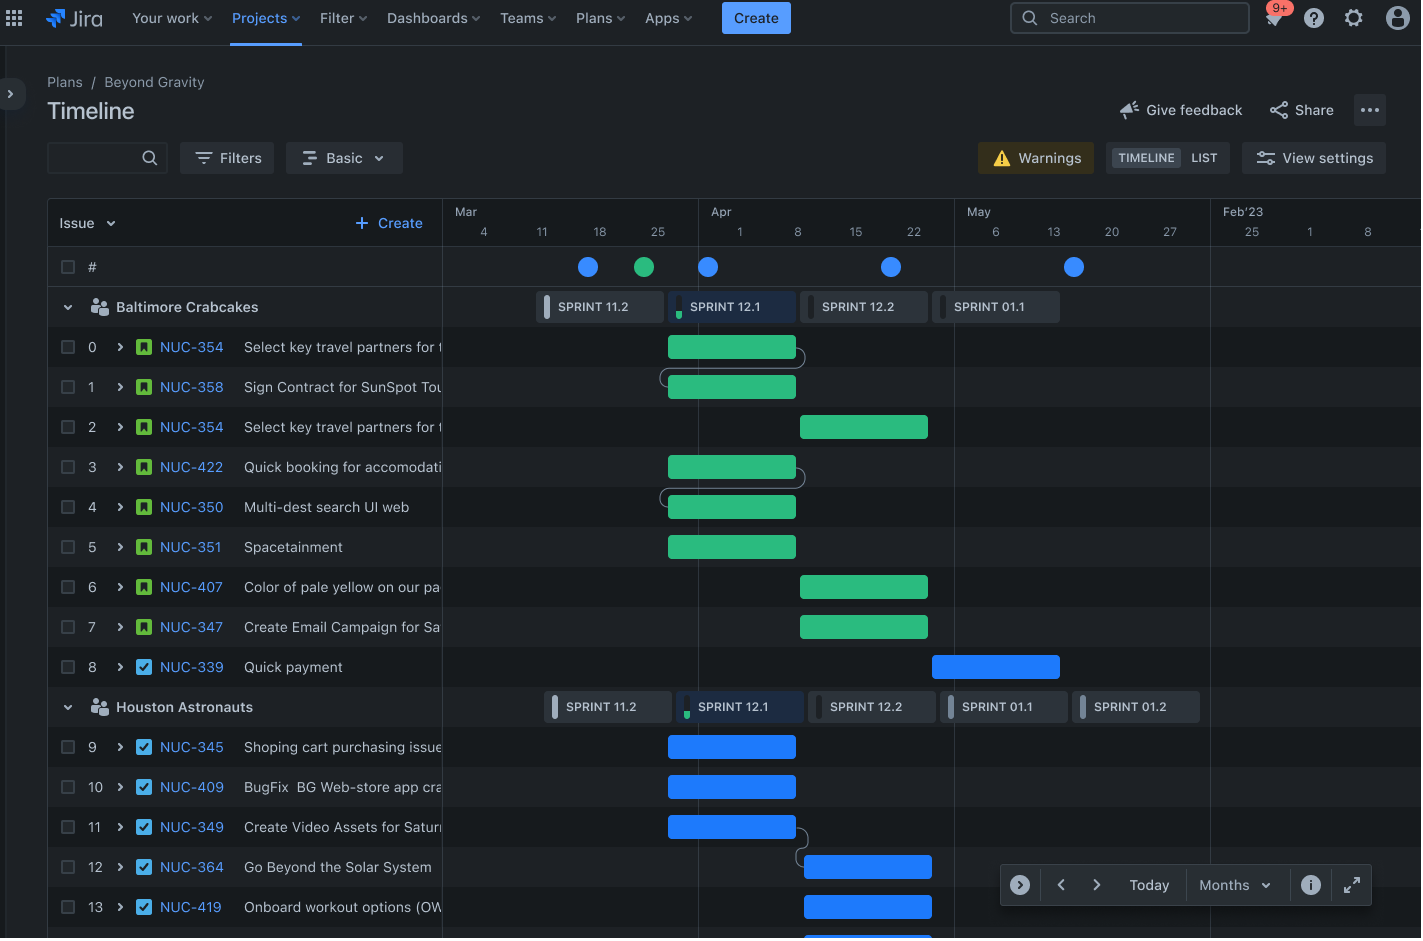
Хронология — это графическое представление расписания проекта, в верхней части которого отображаются даты начала и завершения. Она четко показывает расписание вашего проекта, порядок задач и их продолжительность.
Хронологии помогают заранее выявлять потенциальные узкие места и вносить коррективы, чтобы проект не отставал от графика. Например, маркетинговой команде с помощью хронологии удобно планировать запуск продукта: она дает уверенность, что все рекламные мероприятия будут хорошо организованы и вовремя проведены.
Зависимости
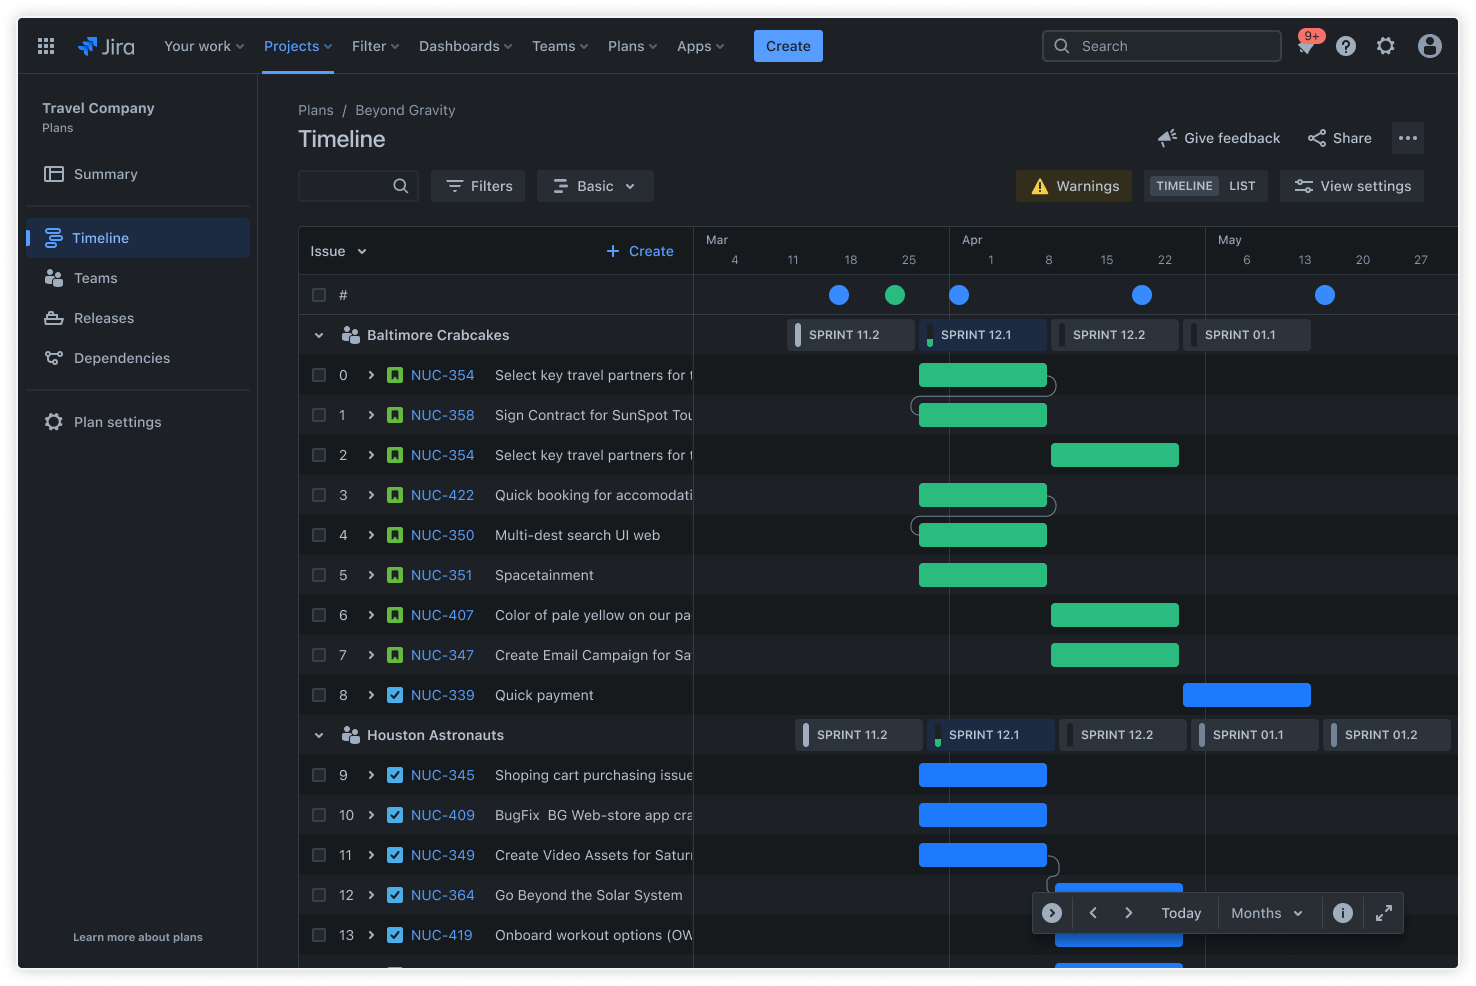
Связи между задачами определяют порядок действий и показывают, как задачи соотносятся друг с другом. Используя Advanced Roadmaps, вы сможете устанавливать зависимости между задачами, чтобы обеспечить верный порядок выполнения.
В то же время с помощью дорожной карты должно быть возможно автоматически корректировать графики при возникновении изменений. Выполнение необходимых задач до начала зависимых задач помогает предотвратить ненужные задержки. Например, в строительном проекте возведение конструкции зависит от завершения закладки фундамента — в этом и проявляетс язависимость в проекте.
Распределение ресурсов

Разбейте крупные проекты или элементы работы на более мелкие и выполнимые части, также называемые «задачами». Используйте их, чтобы собирать сведения о заданиях. Обновляйте статусы задач, чтобы вся команда оставалась в курсе событий.
Эффективное управление ресурсами гарантирует, что участники команды не будут перегружены, а их навыки будут соответствовать задачам.
Список
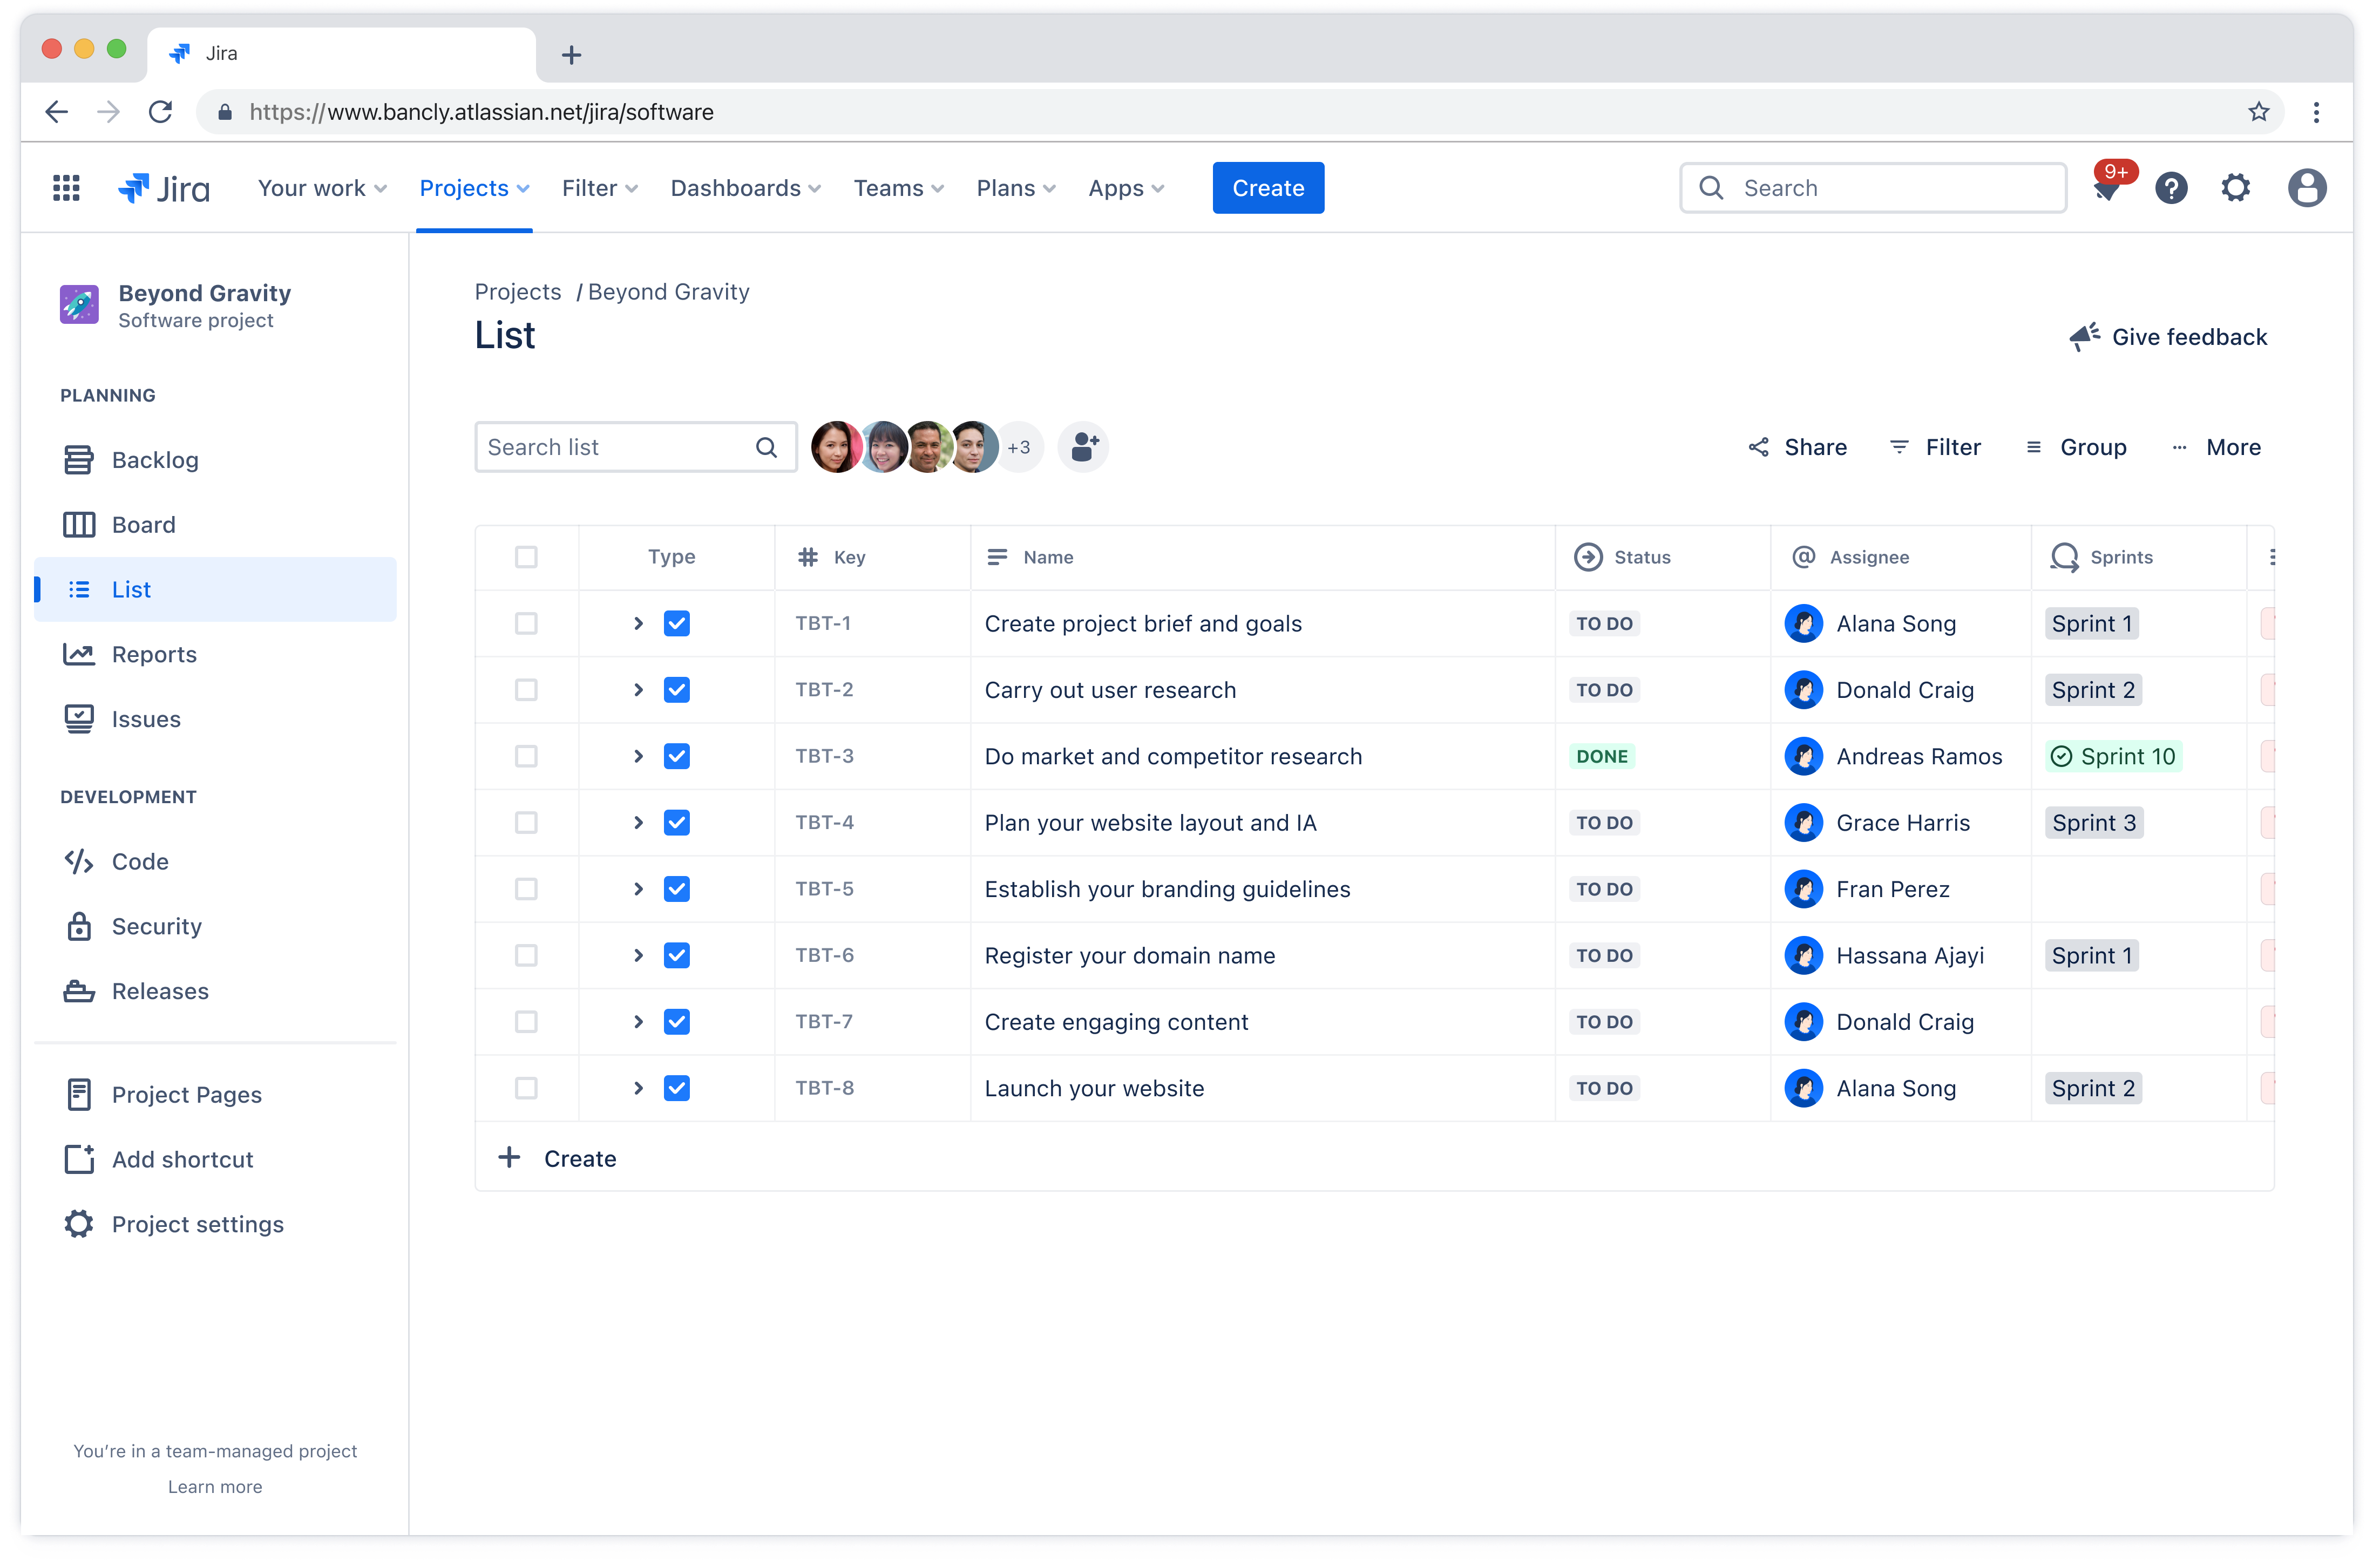
Список задач — это полный перечень всех задач проекта. С ПО для управления проектами можно создавать задачи и управлять ими с помощью системы отслеживания задач.
Она позволяет назначать задачи участникам команды, расставлять приоритеты и отслеживать прогресс. Каждый участник команды будет знать о своих сроках и обязанностях и будет ответственно придерживаться их.
Например, команда разработчиков с помощью этого списка может поручить задачи написания кода, тестирования и развертывания разным исполнителям, чтобы рабочий процесс шел без накладок.
КОНТРОЛЬНЫЕ ТОЧКИ
Контрольные точки проекта на диаграмме Ганта — это маркеры на хронологии, показывающие прогресс всего проекта или завершение его этапов. С помощью правильных инструментов самые главные из них можно отмечать специальными маркерами, чтобы команда могла держать в уме критические сроки и отслеживать достижения.
Контрольные точки вызывают чувство удовлетворения и помогают не растерять мотивацию к выполнению долгосрочных целей. Например, команда разработчиков продукта может задать контрольную точку «завершение этапа создания прототипа», которая будет означать готовность к пользовательскому тестированию.
Плюсы и минусы использования диаграмм Ганта
Как и любой инструмент управления проектами, диаграммы Ганта обладают определенными преимуществами и ограничениями, которые командам следует учитывать.
Ключевые преимущества диаграмм Ганта
Визуальная ясность. Команды могут сразу видеть прогресс проекта, предстоящие сроки и взаимосвязи между задачами.
Улучшенное планирование. Визуальный формат упрощает выявление и учет потенциальных конфликтов при планировании.
Понятная коммуникация. Заинтересованные стороны могут быстро узнать статус проекта, не вдаваясь в подробные отчеты.
Более эффективный тайм-менеджмент. Четкие сроки помогают командам сосредоточиться на приоритетных задачах.
Главные ограничения диаграмм Ганта
Комплексность в рамках крупных проектов. При управлении сотнями задач шаблоны диаграмм Ганта могут оказаться слишком громоздкими.
Требования к техническому обслуживанию. Регулярные обновления необходимы для обеспечения точности и полезности графиков.
Время на освоение. Некоторым участникам команды может потребоваться обучение, чтобы эффективно считывать и обновлять диаграммы.
Когда использовать диаграммы Ганта (и когда это не нужно)
В некоторых сценариях диаграммы Ганта превосходно справляются со своей задачей, но не всегда подходят для каждого типа проекта.
Наиболее эффективные примеры использования:
Крупные проекты с четко установленными сроками. Когда выполнение проекта включает несколько этапов и зависимостей.
Межфункциональные инициативы. Проекты, требующие координации между разными отделами или командами.
Работа с клиентами. Когда заинтересованным сторонам необходимо четкое представление о ходе проекта и его результатах.
Диаграммы Ганта предоставляют мощные возможности визуализации, однако иногда они могут быть слишком сложными для простых рабочих процессов. Можно рассмотреть более простые альтернативы в следующих случаях:
Управление небольшими гибкими проектами. Для agile-спринтов лучше подойдут доски Kanban.
Работа, требования к которой часто меняются. Статичные диаграммы могут быстро устареть.
Управление творческими проектами. В таких случаях процесс носит скорее исследовательский, чем линейный характер.

Кому следует использовать диаграммы Ганта?
Диаграммы Ганта предназначены не только для менеджеров проектов — это ценный инструмент для всех, кому необходимо координировать сложные задачи по срокам и командам. Наибольшую пользу от применения диаграмм Ганта получат следующие роли:
Менеджеры проектов. Менеджеры проектов используют эти диаграммы для всестороннего анализа и стратегического планирования по нескольким инициативам. Подобный визуальный формат позволяет им выявлять потенциальные конфликты между проектами, эффективно распределять ресурсы и мгновенно сообщать о прогрессе заинтересованным сторонам.
Руководители команд. Руководители команд используют диаграммы Ганта для координации работы в своих конкретных отделах или функциональных областях. Они могут точно видеть, когда сотрудники доступны, выявлять потенциальные узкие места до их возникновения и следить за тем, чтобы результаты соответствовали широким срокам реализации проекта.
Менеджеры по операциям. Менеджеры по операциям используют формат диаграммы Ганта для управления повторяющимися процессами и оптимизации управления ресурсами в своих организациях. В отличие от проектной работы, операции часто включают действия циклического характера, требующие тщательной координации для поддержания эффективности.
Имейте в виду, что применение диаграмм в разных отраслях значительно различается. Например, строительные команды широко используют диаграммы Ганта для координации сделок и управления поставками материалов, чтобы гарантировать, что заливка бетона произойдет после создания форм, а электромонтажные работы начнутся только после постройки каркаса.
В свою очередь, команды разработчиков ПО адаптировали диаграммы Ганта для планирования релизов и разработки функций, часто интегрируя их с гибкими методологиями, чтобы визуализировать планирование спринта на более долгий срок.
Как создать диаграмму Ганта
Давайте посмотрим, как создать наглядную и практичную диаграмму Ганта с учетом ее преимуществ. Рассмотрим основные шаги, начиная с определения объема работ и заканчивая отслеживанием прогресса, чтобы вы могли создать диаграмму, которая станет ценным инструментом для успешного выполнения проекта.
Есть два варианта начала работы: создать диаграмму Ганта с нуля, выполнив следующие действия, или сразу перейти к работе с нашим бесплатным шаблоном, включающим готовые разделы и примеры, которые помогут при настройке.
Получите бесплатный шаблон диаграммы Ганта
Шаг 1. Определите область проекта
Первый шаг к созданию диаграммы Ганта — определение объема работ по проекту. Для начала определите основные цели проекта. Четко сформулированные цели послужат ориентиром для проекта, чтобы все задачи согласовывались с ними на протяжении всего жизненного цикла проекта.
Определившись с целями проекта, наметьте основные результаты. Это должны быть конкретные активы, которые необходимо получить в ходе проекта. Шаблон планирования проекта в Confluence предназначен для оптимизации процесса управления проектами.
Он поможет определить область проекта на начальном этапе и спланировать его с указанием четких контрольных точек. После составления плана проекта вы сможете беспрепятственно перейти к созданию задач для всех контрольных точек и результатов, обеспечивая структурированный и эффективный рабочий процесс.
Шаг 2. Перечислите все задачи и подзадачи
Затем перечислите все задачи, необходимые для получения определенного результата. Разбейте большие задачи на более мелкие, чтобы наглядно показать, что нужно сделать вашей команде. Для каждой подзадачи определите ответственного участника команды и необходимые ресурсы.
Эффективным способом создания и организации этих задач в структуре диаграммы Ганта считаются задачи в Jira. Каждая из них может представлять конкретную задачу или подзадачу, для которой вы можете назначать участников команды, задавать приоритет и отслеживать прогресс прямо в хронологии проекта.
Профессиональный совет: воспользуйтесь интеграцией Rovo с Jira и Confluence, чтобы без усилий преобразовать планы проектов в подробные задачи в Jira. Это заметно упростит ваш рабочий процесс и повысит его эффективность. Узнайте, как Rovo преобразует планы проектов в выполнимые заявки Jira, прямо сейчас!
Шаг 3. Оцените продолжительность задач
Определите, сколько времени потребуется на выполнение каждой задачи. Будьте реалистичны и учитывайте возможные задержки. Чтобы учесть непредвиденные отсрочки и обеспечить выполнение проекта в срок, заложите в расписание запас времени.
Шаг 4. Определите зависимости между задачами
Установите последовательность задач. Некоторые задачи можно начать только после выполнения других. Для определения взаимосвязей между ними используйте такие типы зависимостей, как «закончить, чтобы начать» или «начать, чтобы начать».
С помощью компонента Jira Advanced Roadmaps, который теперь называется «Планы», команды могут составлять исчерпывающие дорожные карты проектов, которые наглядно показывают взаимосвязи между задачами и автоматически корректируют хронологии в случае изменений. Таким образом ваша диаграмма Ганта всегда будет точно отражать актуальное состояние проекта.
Шаг 5. Выберите инструмент для построения диаграммы Ганта
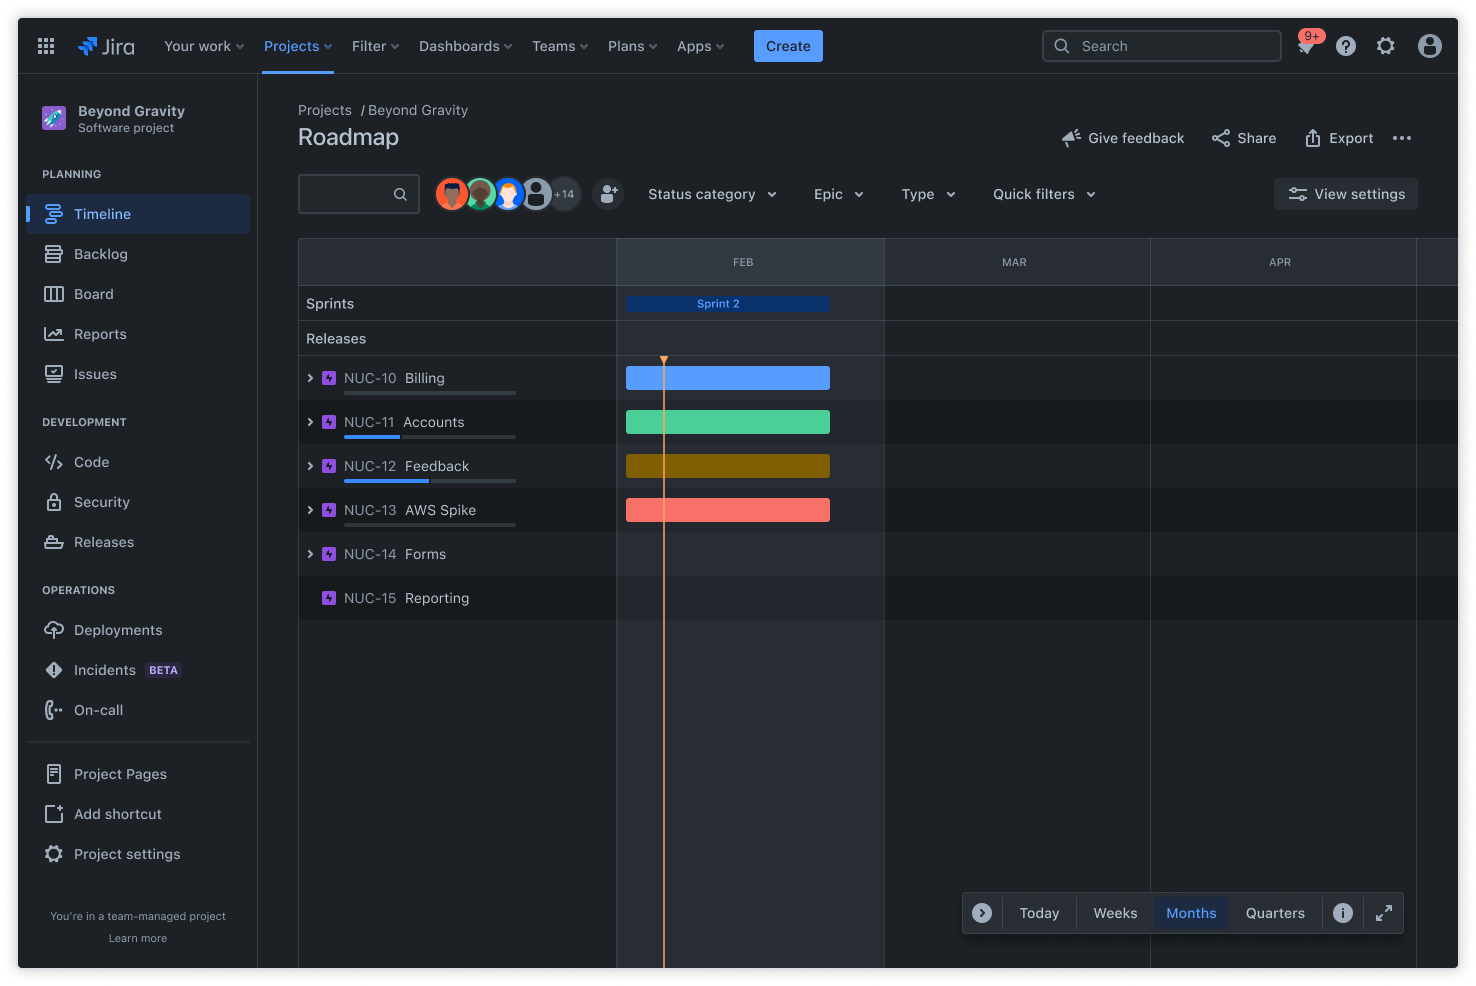
Выбирая инструмент для создания диаграммы Ганта согласно потребностям своего проекта, учитывайте несколько ключевых факторов.
Jira — отличный вариант для создания диаграмм Ганта, особенно для команд разработчиков программного обеспечения и маркетологов. Такие инструменты, как хронологии и планы, помогают создавать расширенные дорожные карты. С этими функциями можно осуществлять детальное управление задачами, отслеживать зависимости и распределять ресурсы. Для упрощения процесса можно использовать шаблон диаграммы Ганта.
Попробуйте бесплатный инструмент для построения диаграмм Ганта
Шаг 6. Внесите данные
С Jira не нужно вручную вносить данные в диаграмму Ганта. Создав задачи на основе плана проекта, вы можете легко перейти в представление хронологии или использовать Advanced Roadmaps от Jira в качестве диаграммы Ганта.
Эта функция автоматически отражает продолжительность задач, зависимости и ключевые контрольные точки, тем самым обеспечивая актуальность и точную визуализацию хронологии проекта.
Оптимизируйте свои проекты с помощью диаграмм Ганта в Jira
Jira делает планирование и выполнение проектов эффективнее благодаря мощной визуализации хронологий и обширным возможностям отслеживания задач. С помощью функции динамической хронологии в Jira можно автоматически обновлять диаграммы, чтобы отразить изменения задач, дат и зависимостей, обеспечивая актуальность плана проекта.
С решением Advanced Roadmaps вы получаете представление портфеля, которое идеально подходит для управления комплексными инициативами с участием нескольких команд. Эта функция не ограничивается простым составлением последовательности задач: она автоматически рассчитывает влияние изменений на всю хронологию проекта и определяет, на какие задачи влияют задержки.
Confluence дополняет Jira и усиливает эффективность рабочего процесса управления проектами и внедрения хронологии. Jira отлично подходит для исполнения и отслеживания, однако Confluence выступает в качестве единого центра проектной документации, сбора требований и коммуникации с заинтересованными сторонами.
Хронологию Jira можно встраивать прямо в страницы Confluence в режиме реального времени, создавая комплексные панели управления проектами, сочетающие визуальные расписания с подробным контекстом проекта, протоколами собраний и отчетами по статусу.
Gantt Chart Frequently Asked Questions
What is the main purpose of a Gantt chart?
A Gantt chart is a visual timeline used to plan, schedule, and track tasks and milestones throughout a project's lifecycle. It helps teams coordinate work, manage dependencies, and communicate progress.
What are the 7 important elements of a Gantt chart?
Key elements of a Gantt chart include the timeline, task list, dependencies, resource allocation, milestones, progress tracking, and assignees. These components provide a comprehensive view of project status and responsibilities.
What are common mistakes when making a Gantt chart?
Common mistakes include overcomplicating the chart, failing to update it regularly, not accounting for dependencies, and underestimating task durations. These issues can lead to confusion and project delays.
What are the 5 steps to building a Gantt chart?
The five steps are: define the project scope, list all tasks and subtasks, estimate task durations, determine task dependencies, and choose a Gantt chart tool to visualize and manage the schedule.
Рекомендовано для вас
Шаблоны
Готовые шаблоны Jira
Ознакомьтесь с нашей библиотекой настраиваемых шаблонов Jira для различных команд, отделов и рабочих процессов.
Руководство по продукту
Подробное знакомство с Jira
Воспользуйтесь этим пошаговым руководством, чтобы узнать об основных функциях и передовых методах для повышения производительности.
Руководство по Git
Понимание основ Git
От новичка до опытного эксперта: используйте это руководство по Git, чтобы изучить основы с помощью обучающих материалов и полезных советов.